

The percentage of US households with video streaming has dropped to 87%, (down 0.3% points quarter-on-quarter), after growing in Q2’22. There are 113M households accessing streaming services as of September 2022. Despite the small decline in total video streaming, it is entirely driven by a select few SVoD (paid, ad-free) streaming platforms. There is still growth coming from AVoD (paid, ad-supported) and FAST (free, ad-supported) streaming in Q3’22.
That’s according to Kantar’s Entertainment on Demand (EoD) streaming analytics service, which looks at streaming consumer behavior. Q3-2022 Highlights of the analysis include:
- AVoD and FAST continue to be the fastest growing sectors in the streaming market. While SVoD declined 1% quarter-on-quarter to reach 82% of US households, AVoD grew by 1% point to 28% household penetration. FAST grew by 1% point to 24% household penetration.
- Growth of both AVoD and FAST slowed in Q3’22 compared to its growth in Q2’22 and Q1’22.
- Stacking has continued to grow quarter over quarter, with the average streaming household accessing 5.2 different streaming services, up from 5.0 in Q2’22.
- For platforms with multiple tiers, SVoD performed very well, particularly for Hulu (SVoD + 8% vs AVoD -3%) and Paramount + (SVoD + 44%, AVoD +26%).
- The decline in Cable TV has slowed significantly, losing roughly a quarter million subscribing customers in Q3’22 compared to the 1M it lost in Q2’22. Household penetration is at 55%.
- In the US, Netflix, Amazon Prime Video and Showtime were the only SVoD platforms to lose subscribers in Q3’22. Netflix and Showtime continued their trend of losing US subscribers, while Amazon Prime Video losses were expected after its Prime Day growth.
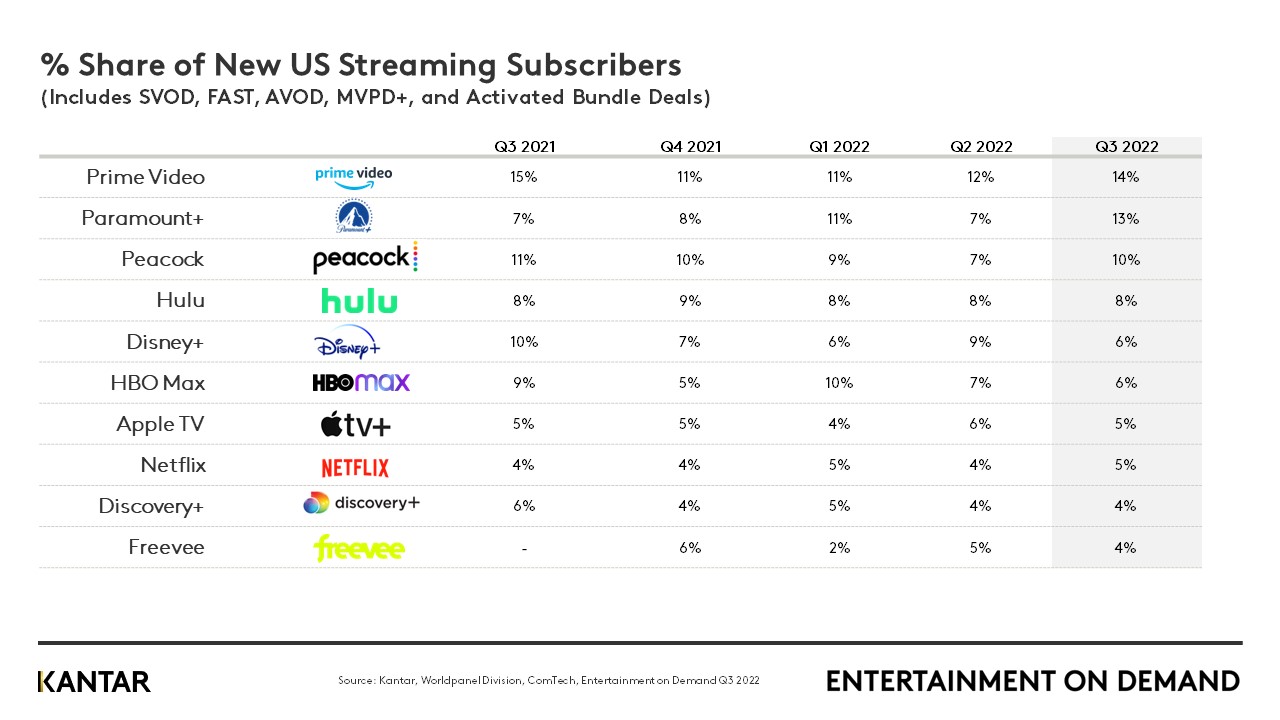
- Despite losing subscribers overall, Amazon Prime Video was still the #1 destination for new video streaming subscribers, closely followed by Paramount+.
Market trends
In Q3’22, the total streaming market was flat, with total US household penetration dropping by just 0.3%. This flatlining is driven by SVoD (paid, ad-free) streaming, while AVoD (paid, ad-supported) and FAST (free, ad-supported) offerings are still seeing growth. The decline of the SVOD category was driven entirely by Netflix, Amazon Prime Video, and Showtime. When excluding these three platforms, it is clear the state of the SVoD industry is still very healthy. Below the surface, most SVoD platforms saw growth in Q3’2022, driving the rest of the SVoD category up by 3%. Meanwhile household AVoD penetration also rose 3%, and FAST by 6%.
As most streaming platforms saw growth in Q3’2022, stacking continued to rise. Stacking has again reached a record number, with households on average accessing 5.2 streaming services (up from 5.0 in Q2’22).
In Q2’22, with the growth of AVoD far outpacing SVoD, it was clear consumers were willing to reduce the cost of their subscription repertoire by watching ads. But in Q3’22, both SVoD (excluding Netflix, Amazon Prime Video and Showtime) and AVoD grew at similar rates as stacking also grew. Now, consumers are discovering which platforms they value more at a higher cost than others. For example, for Hulu, its SVoD offering helped drive growth, but for Peacock, it was AVoD.
Cable TV cancellation also slowed in Q3’22. In Q2’22, Cable TV lost more than 1M households, but in Q3’22, that number reduced to just 0.3M. Consumer behavior towards ads and spending has shifted in Q3’2022. Viewers are no longer cutting costs and choosing ads at the rate they were in Q2. Instead, they are more likely to keep their Cable TV and subscribe to higher cost streaming than they were in the previous quarter. While this is a positive outlook for streaming as a whole, it may not continue as the economic outlook worsens over the next year. Platforms must continue proving their value to justify their cost.
Content trends
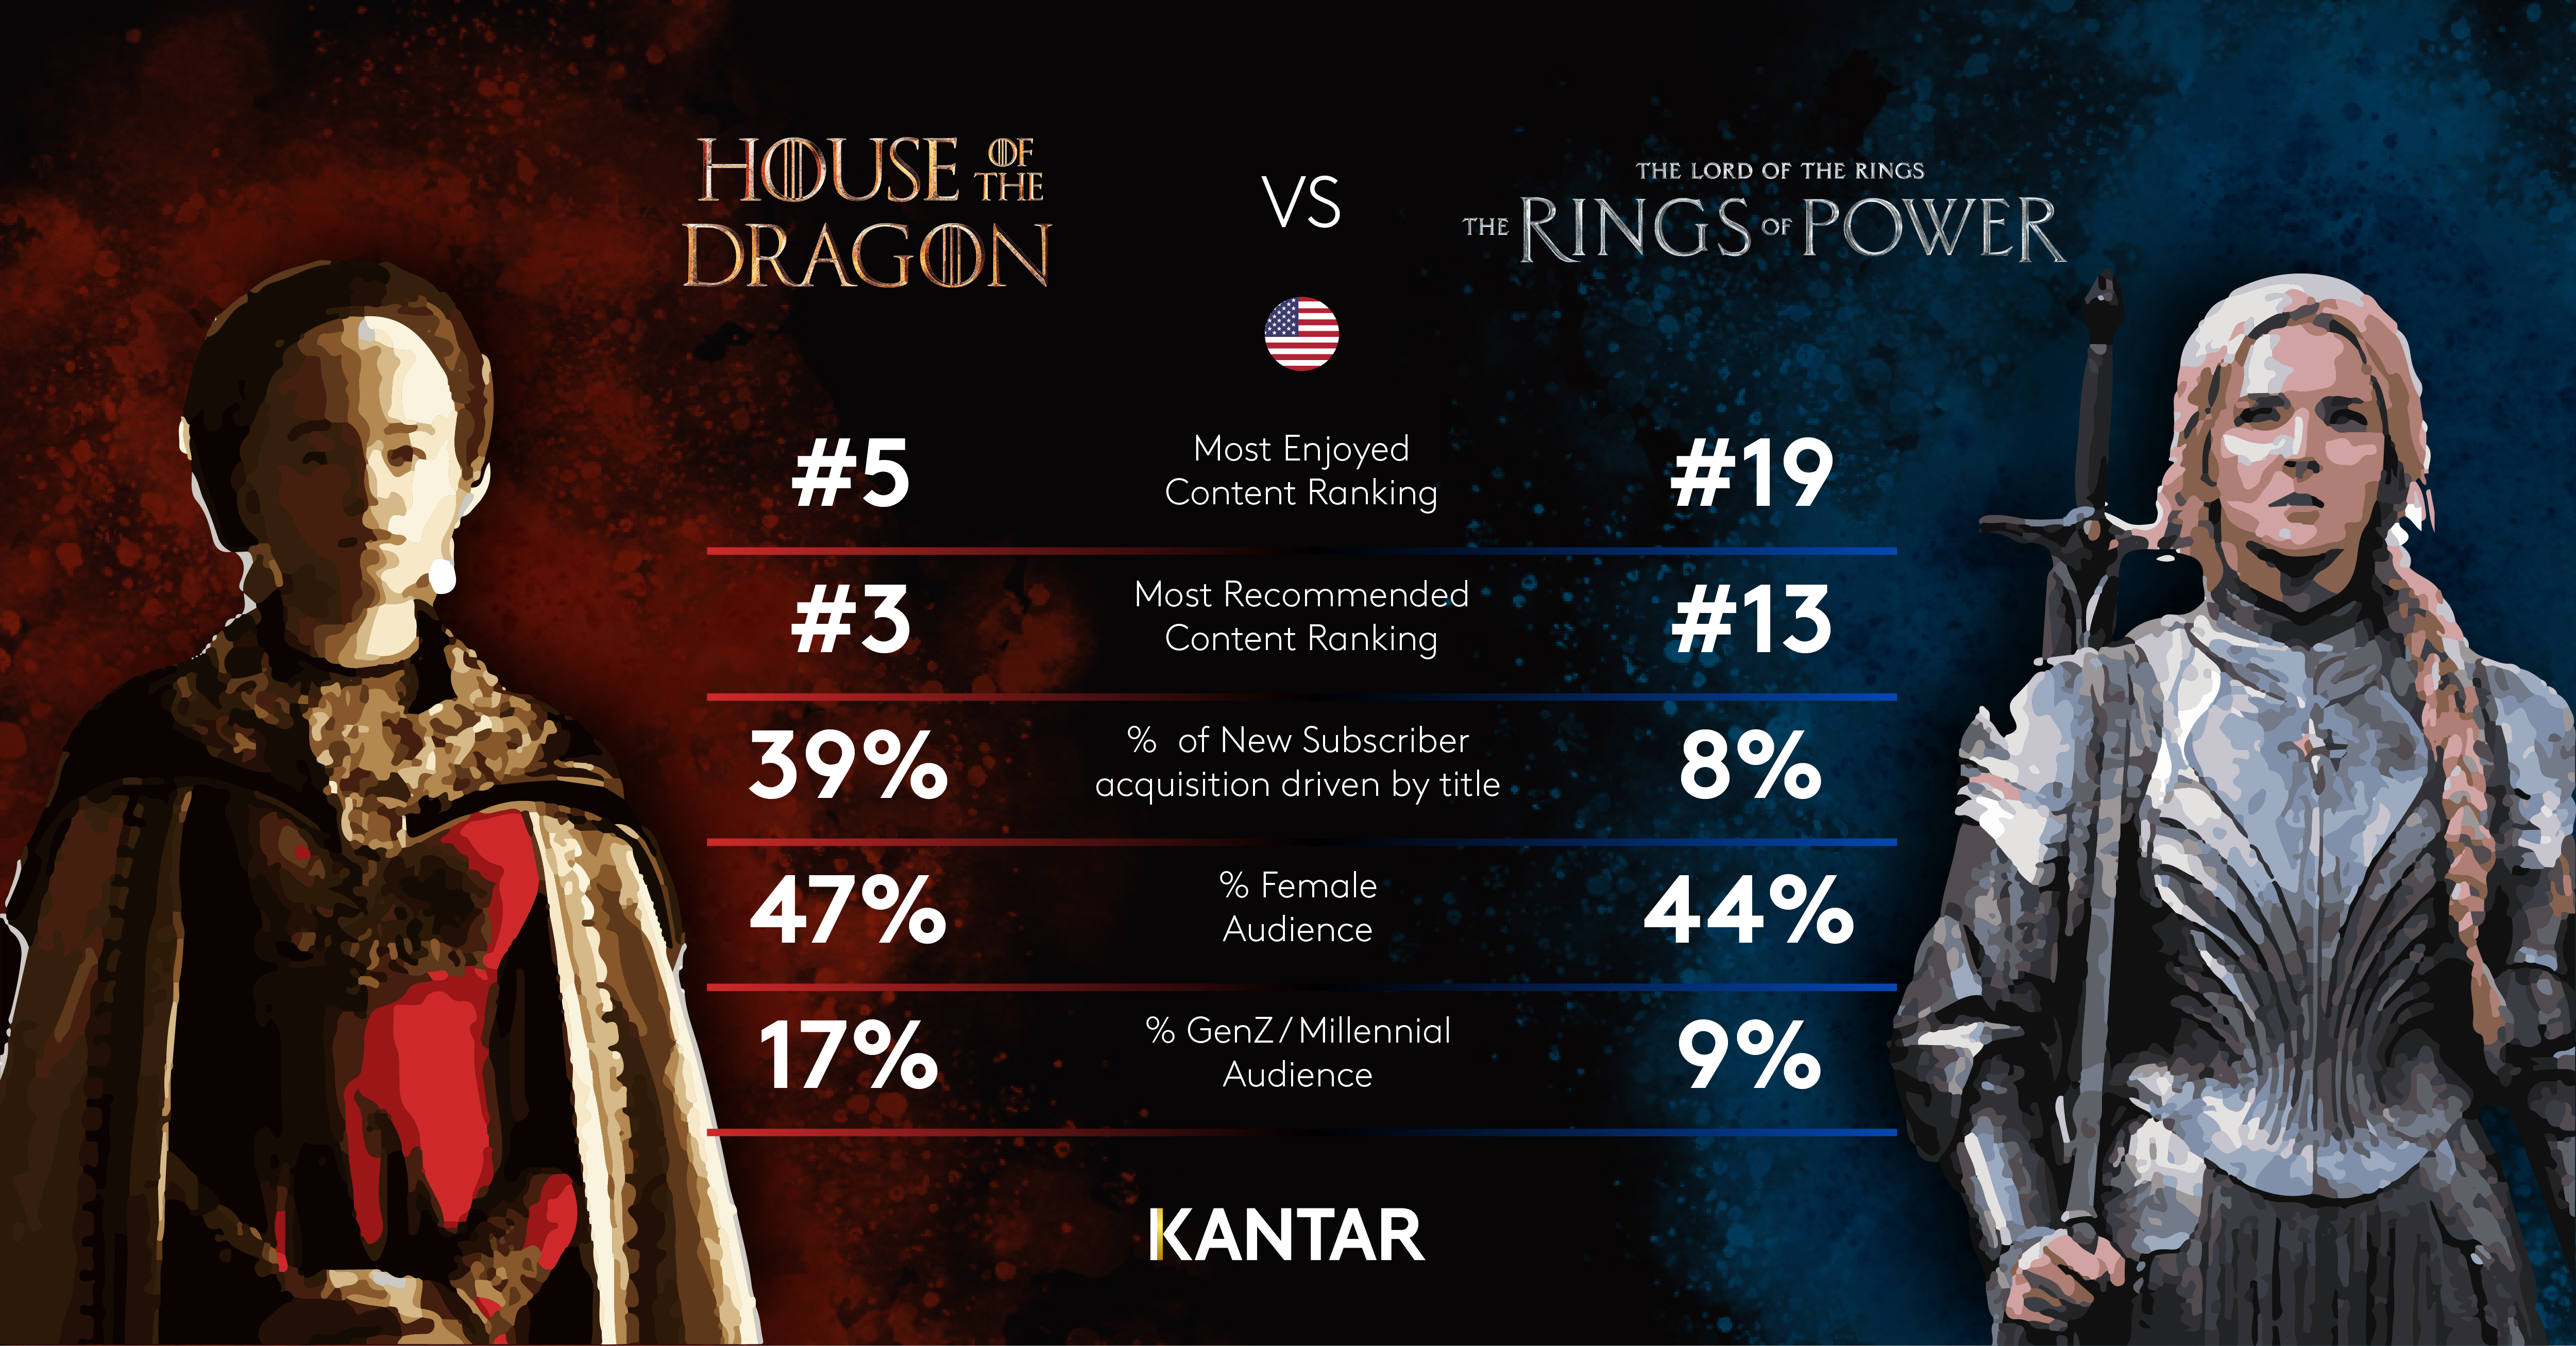
Top Content that led to sign-ups in Q3’22: House of the Dragon, Stranger Things, Yellowstone, Sports/NFL, The Boys.
Top Content that was cited as most enjoyed in Q3’22: Stranger Things, Virgin River, Better Call Saul, Only Murders in the Building and House of the Dragon. Most of the top titles are higher budget and original, where typically the ROI pays off.
Apple TV+ and Paramount+
Both Apple TV+ and Paramount+ had strong growth in Q3’22. Apple TV+ now has a market share of 10%, growing 12% quarter-on-quarter. Meanwhile Paramount+ now has a market share of 14%, growing 35% quarter-on-quarter. Substantial growth in market share provides a strong outlook for both platforms, but beneath the surface there are risks. Drivers of growth and cancellation of both platforms overlap, indicating common consumer behaviors other platforms can learn from.
Both Apple TV+ and Paramount+ grew in Q3’22 due to specific content driving sign up. 43% of new Apple TV+ and 46% of new Paramount+ subscriptions were driven by specific content (vs 33% total market). As Apple TV+ has shown in the past with “Ted Lasso”, these new subscribers often cancel their subscription after watching the title they joined for. Already, cancellation for both platforms in Q3’22 was disproportionately driven by having watched the specific content that drove sign-up. Both Apple TV+ and Paramount+ also faced cancellation in Q3’22 due to technical difficulties, it being a challenge to find content to watch, and already high stacking of these subscribers.
To minimize the potential risk of churn for new subscribers who join for a specific title, streaming platforms must put more focus on the functionality of their interface. If subscribers can’t easily find a new title to watch, regardless of the quality and quantity of content available, they are more likely to churn from the platform. The interface and recommendations become an important tool for retention. Both Apple TV+ and Paramount+ illustrate that marketing a single title can drive growth, but without a great user experience post-sign up, retention is a challenge.
Netflix
While Netflix reported an increase in subscriber growth globally, according to Kantar’s EoD research, there was a decline in US subscriber counts for Q3’22. Netflix now has a US market share of 61% in Q3’22, down from 66% in Q3’21. While Apple TV+ and Paramount+ see cancellations due to interface related issues, Netflix cancellations are largely driven by cost. In fact, 2 out of the 3 top reasons for cancelling Netflix in Q3 have to do with money: wanting to save money (38% of cancelled subscriptions) and unwillingness to pay Netflix’s new higher prices (17% of cancelled subscriptions). The upcoming AVoD service may help with their consumer’s cost related drivers. Those who have previously cancelled due to high cost now have a lower cost option that may keep them on the platform, among other key drivers of AVoD consumers.
AVoD is also a consistently growing market, meaning Netflix can expect to gain new subscribers through its AVoD offering. Yet, there are risks. Netflix can expect a portion of its subscriber base to trade down in order to save money. Additionally, AVoD subscribers tend to churn at a higher rate than SVoD subscribers. Netflix can expect a quicker cycle of sign up, cancellation, and return among their AVoD subscribers.
Streaming tiers rising: FAST | AVoD | MVPD
The overlap of subscribers who have multiple pricing tiers in their streaming repertoire is growing over time. Yet, there are still clear differences in who and what is driving growth for each type of streaming platform and where their strengths lie.
Contact our experts for a more detailed report on the performance of these three streaming options.
Looking ahead
Despite the uncertainty around the US economy, the streaming industry remains solid. Streamers are no longer consistently looking for ways to manage the cost of their repertoires. They are looking for platforms to understand their respective needs and tailor to them.
Specific churn rates are predicted for Q4’22 in Kantar’s EoD streaming service, and expect to see boomerang behavior across all streaming tiers. In understanding these measures and what drives viewers, platforms can be well positioned to retain their base and grow.
If you would like to learn more, reach out to our experts or access our interactive data visualisation tool.