In 2018, 96% of FMCG growth took place outside hyper and supermarkets, e-commerce grew 20%, discounters have been appearing almost everywhere, and new hybrid retail formats are becoming more common place around the globe.
While GDP growth has been stablein recent years, growing on average +3.5% per year, FMCG growth has been slowing—from +6% to +2.1% since 2012. The table below may suggest growth in every region, but the data alone does not always tell the whole story. In fact, 2018 saw a continued slowdown in every market we’ve analysed—other than China Mainland and the US.
|
FMCG value growth (%) |
2017 |
2018 |
|
Global |
1.9% |
2.1% |
|
Africa & Middle East |
8.8% |
6.1% |
|
Asia |
3.1% |
2.8% |
|
Eastern Europe |
5.3% |
1.2% |
|
Western Europe |
2.7% |
1.7% |
|
Latin America |
5.7% |
3.9% |
|
US |
0.9% |
1.6% |
Source: Kantar
The fragmentation of the FMCG landscape continues apace. Across the channels we’ve analysed, there is an obvious divide between those doing well and those struggling to keep up. E-commerce is far outstripping any other medium—achieving 20.3% growth in 2018, accelerating on its 15% growth in 2017.
|
% Global value share |
2017 |
2018 |
2018 Growth |
Forecast |
|
E-commerce |
4.3 |
5.1 |
20.3 |
10.1 |
|
Hyper/Super |
56.9 |
55.8 |
0.1 |
48.0 |
|
Discounters |
10.3 |
10.6 |
5.7 |
13.4 |
|
Convenience |
4.1 |
4.1 |
2.5 |
4.4 |
|
Cash & carry |
3.3 |
3.4 |
5.4 |
5.1 |
|
Traditional trade |
8.4 |
8.4 |
2.4 |
8.3 |
|
Drugstore & pharmacy |
6.7 |
6.6 |
1.0 |
6.2 |
|
Others |
6.0 |
6.0 |
n/a |
4.5 |
Source: Kantar
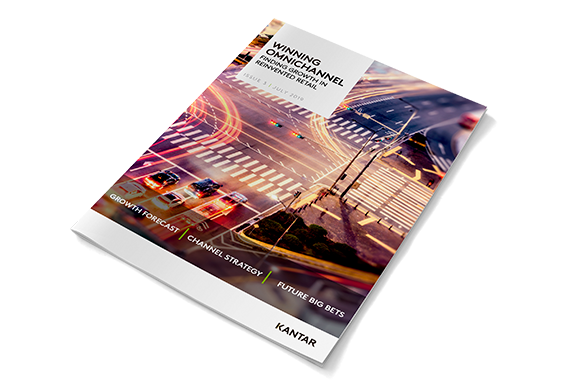
Our publication Winning Omnichannel – Finding growth in reinvented retail explores where to grow and how to win in a context in which global sales grew just 2.1%. This is our most comprehensive Omnichannel study yet, based on data from across 47 countries, representing 83% of GDP providing a unique picture of retail & shopper dynamics across the globe.

Download our new publication, watch the webinar or contact our experts and learn how to make the most of these findings for your business.

