
Kantar’s connected media intelligence has allowed us to analyze promotion trends for the first half of 2021 and provide updated insights into brand advertising and promotion activity. This mid-year catch-up provides highlights from our analysis of the 2021 digital and print promotions landscape with a focus on digital growth and recovery following a year of uncertainty. Within this analysis, print data includes Free Standing Inserts (FSI) while digital data includes Kantar’s footprint of 100 leading websites (excluding Amazon.com).
The promotion landscape
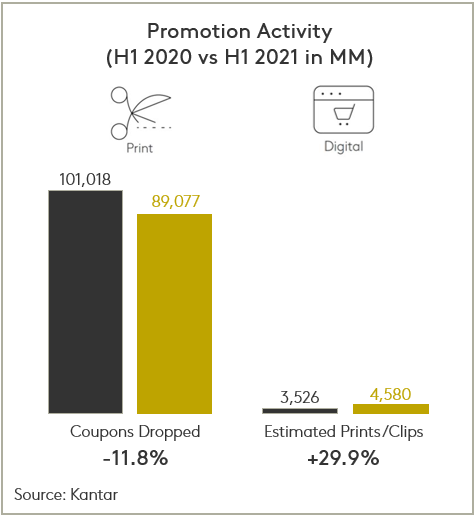
This year, Kantar reports that FSI Print promotion activity fell 11.8% to 89B coupons dropped in the first half of 2021.
This decline was driven primarily by Dry Grocery, Household Products and Personal Care with the most notable downward shift coming from Household Cleaning Products. Food areas saw a combined reduction of 29%, further shifting the balance of Print couponing toward Non-Food which now accounts for 83% of total FSI coupons dropped.
Despite downward pressure, key areas remained strong within Print promotion - although Personal Care saw fewer overall coupons in H1 2021, it remained the top FSI coupon area with 35 billion coupons dropped. In addition, Personal Care included the top 5 product types to add coupons in H1 2021: Bar/Liquid Soap, Suncare, Hair Care, Facial Moisturizer and Hand & Body.
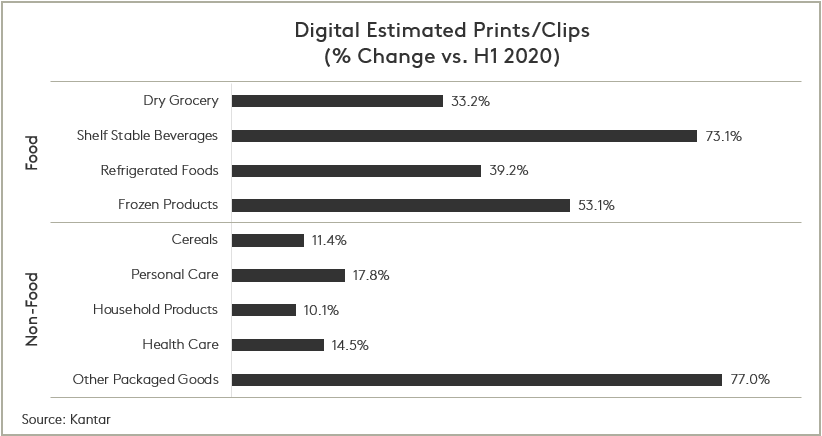
In Digital, Kantar measured a 29.9% increase in estimated clips/prints to nearly 4.6 billion with all product areas reporting increases vs. H1 2020.
Food areas saw a combined increase of 39% and accounted for 65% of total Digital estimated prints/clips. Dry Grocery and Shelf-Stable Beverages added the largest number of estimated clips/prints with Alcoholic Beverages, Beverages and Snacks showing the greatest year over year growth. 130 out of 155 product types showed growth in Digital estimated prints/clips in H1 2021 compared with just over 35 product types in H1 2020.
While the long-term effects of the COVID-19 pandemic are still evident in H1 2021, we have also begun to see signs of recovery within promotion.
Despite the year over year decrease, Print followed a similar pattern of month-to-month activity as H1 2020 with coupons dropped beginning to stabilize around May/June 2021.
Digital has already begun to bounce back and grow with the number of estimated prints/clips in April, May and June 2021 far exceeding those in H1 2020. Retailer properties drove this recovery with a 42% year over year increase in estimated prints/clips as manufacturers worked even more closely with retailers to deliver their digital incentives to shoppers.
What's it worth?
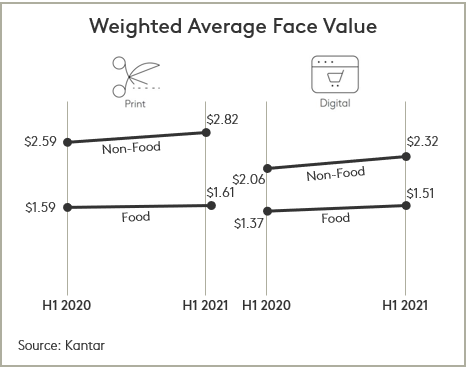
In both Print and Digital, the high-level 2020 trend of increasing Weighted Average Face Values continued across Food and Non-Food manufacturers.
In H1 2021, Kantar reports that the largest face value increase was in Print where Non-Food manufacturers increased their face values $0.23 to $2.82 on average. Driving this trend were Health Care where Print face values rose $0.23 to $3.43 and Personal Care where incentives increased $0.16 to $2.58.
In Digital, Food face values increased $0.14 to $1.51 while Non-Food face values increased $0.26 to $2.32. The largest area incentive increases came from Shelf-Stable Beverages (+$0.20) and Household Products (+$0.23).
New product support
So far in 2021, Kantar has captured just over 1,100 new products in Print and Digital with Dry Grocery leading all other areas in total number of new products launched by a wide margin.
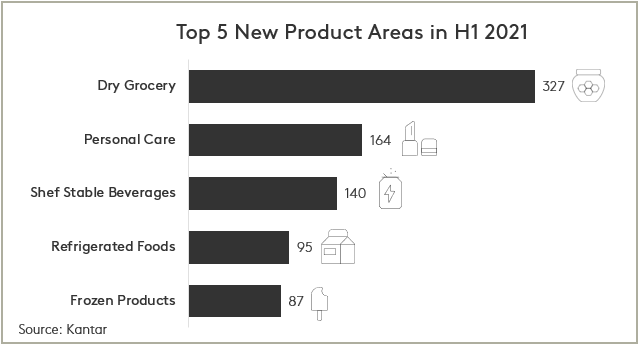
293 of these new Dry Grocery products were first seen in Digital, where manufacturers have increasingly turned to promote their new products. While Food dominates the number of new products in Digital, all Non-Food areas saw year over year increases in new products first seen in Digital.
In both Print and Digital, Kantar measured an increase in the average number of events that manufacturers ran in support of new Food products, with an average of 1.6 events per new product in Print (+23.1%) and 2.5 events per new product in Digital (+13.6%). In Print, Household Products had the highest average number of events per new product with 3.0 events, while in Digital, Cereal had the highest average number of events per new product with 7.7 events.
Spotlight on unique digital offers
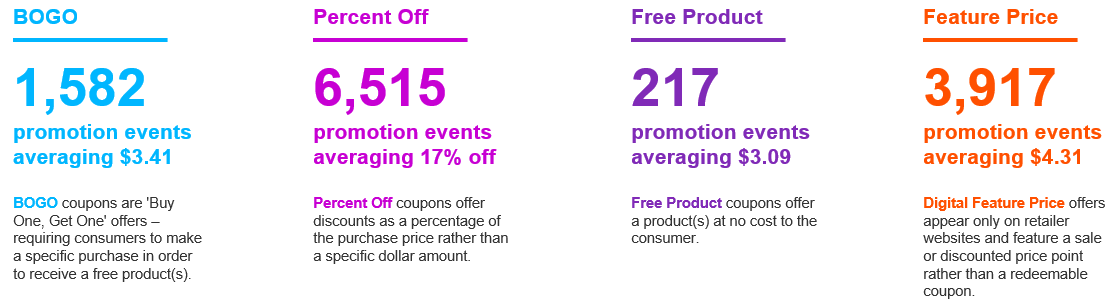
- BOGO: 1,582 promotion events averaging $3.41. The largest BOGO area was Dry Grocery with 856 promotion events, while the highest incentive BOGO area was Health Care averaging $6.63.
- Percent Off: 6,515 promotion events averaging 17% off. The largest Percent Off area was Dry Grocery with 2,410 promotion events, while the highest incentive Percent Off areas were Frozen Products and Personal Care averaging 20% off.
- Free Product: 217 promotion events averaging $3.09. The largest Free Product area was Dry Grocery which saw 90 promotion events, while the highest incentive Free Product area was Frozen Products averaging $6.18.
- Digital Feature Price: 3,917 promotion events averaging $4.31. The largest Digital Feature Price area was Dry Grocery with 1,447 promotion events, while the lowest featured prices were found in Cereals averaging
- Digital Rebates: Digital Rebates grew 26% to nearly 4.6B estimated prints/clips and accounted for 9.2% of all Digital coupons in H1 2021.
Want to know more?
These insights are just the beginning of the visibility you can gain into promotional activity in your market and across your competitive set. For additional details, please fill out the form below: