
Kantar’s connected media intelligence has allowed us to analyze distribution trends for the first half of 2022 and provide updated insights into brand advertising and promotion activity. This mid-year catch-up provides highlights from our analysis of the 2022 Print and Digital promotions landscape with a focus on areas of strength and growth within CPG couponing. Within this analysis, print data includes Free Standing Inserts (FSI) while digital data includes Kantar’s full footprint of 100 leading websites (excluding Amazon.com). In March 2022, Kantar restated Digital estimated prints and other metrics in line with updates to our Digital event methodology – all comparisons to prior years within this analysis utilize restated data.
The promotion landscape
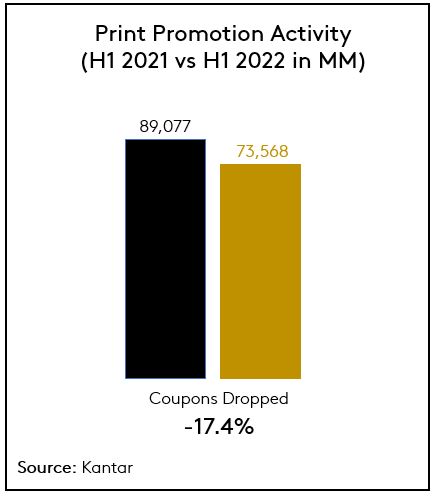
This year, Kantar reports that Print promotion activity fell 17.4% to 74B coupons dropped in the first half of 2022 with 141 CPG manufacturers participating in FSI couponing.
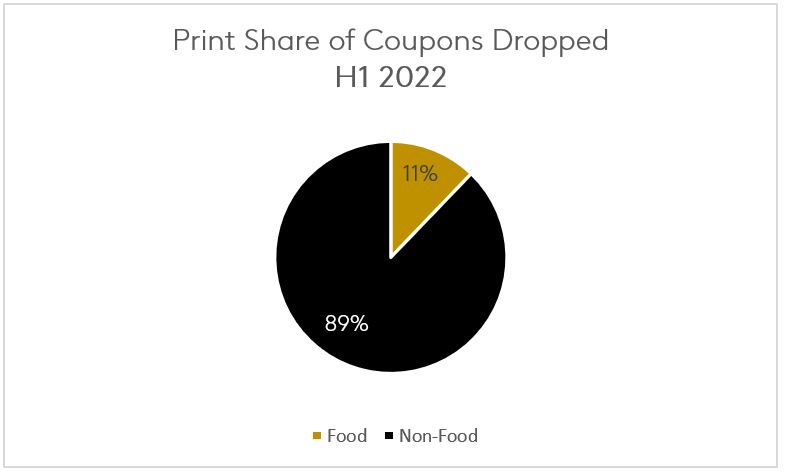
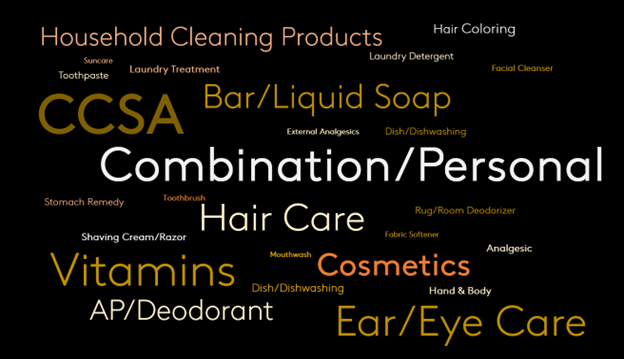
This decline was driven primarily by Food areas where categories decreased coupons dropped between 35% and 73% vs. H1 2021 with the most notable downward shift coming from Cereals. Non-Food areas continue to dominate Print promotion accounting for 89% of total FSI coupons dropped driven by the Personal Care and Health Care. Additionally, Household Products was the third highest couponing area growing 15% to nearly 10B coupons dropped in H1 2022. From CCSA to Fabric Softener, the top 25 product types seen in Print promotion during the first half of the year fell under the umbrella of these top three areas.
Despite the downward pressure on Food categories, there were still a handful of product types where manufacturers increased FSI couponing in H1 2022 – most notably Dinner Mixes and kitchen staples like Butter/Margarine and Rice.
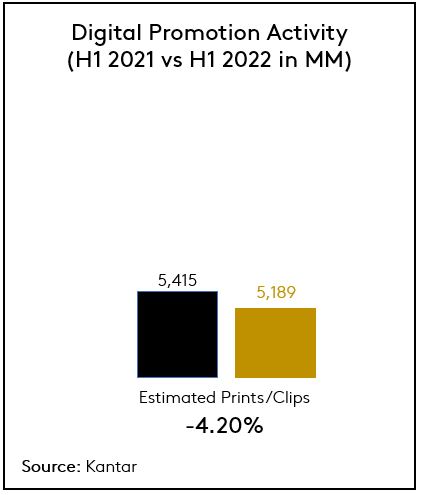
In Digital, Kantar measured a slight decrease of 4.2% estimated prints maintaining nearly 5.2B estimated clips/prints in H1 2022 with 2,236 CPG manufacturers participating in Digital couponing.
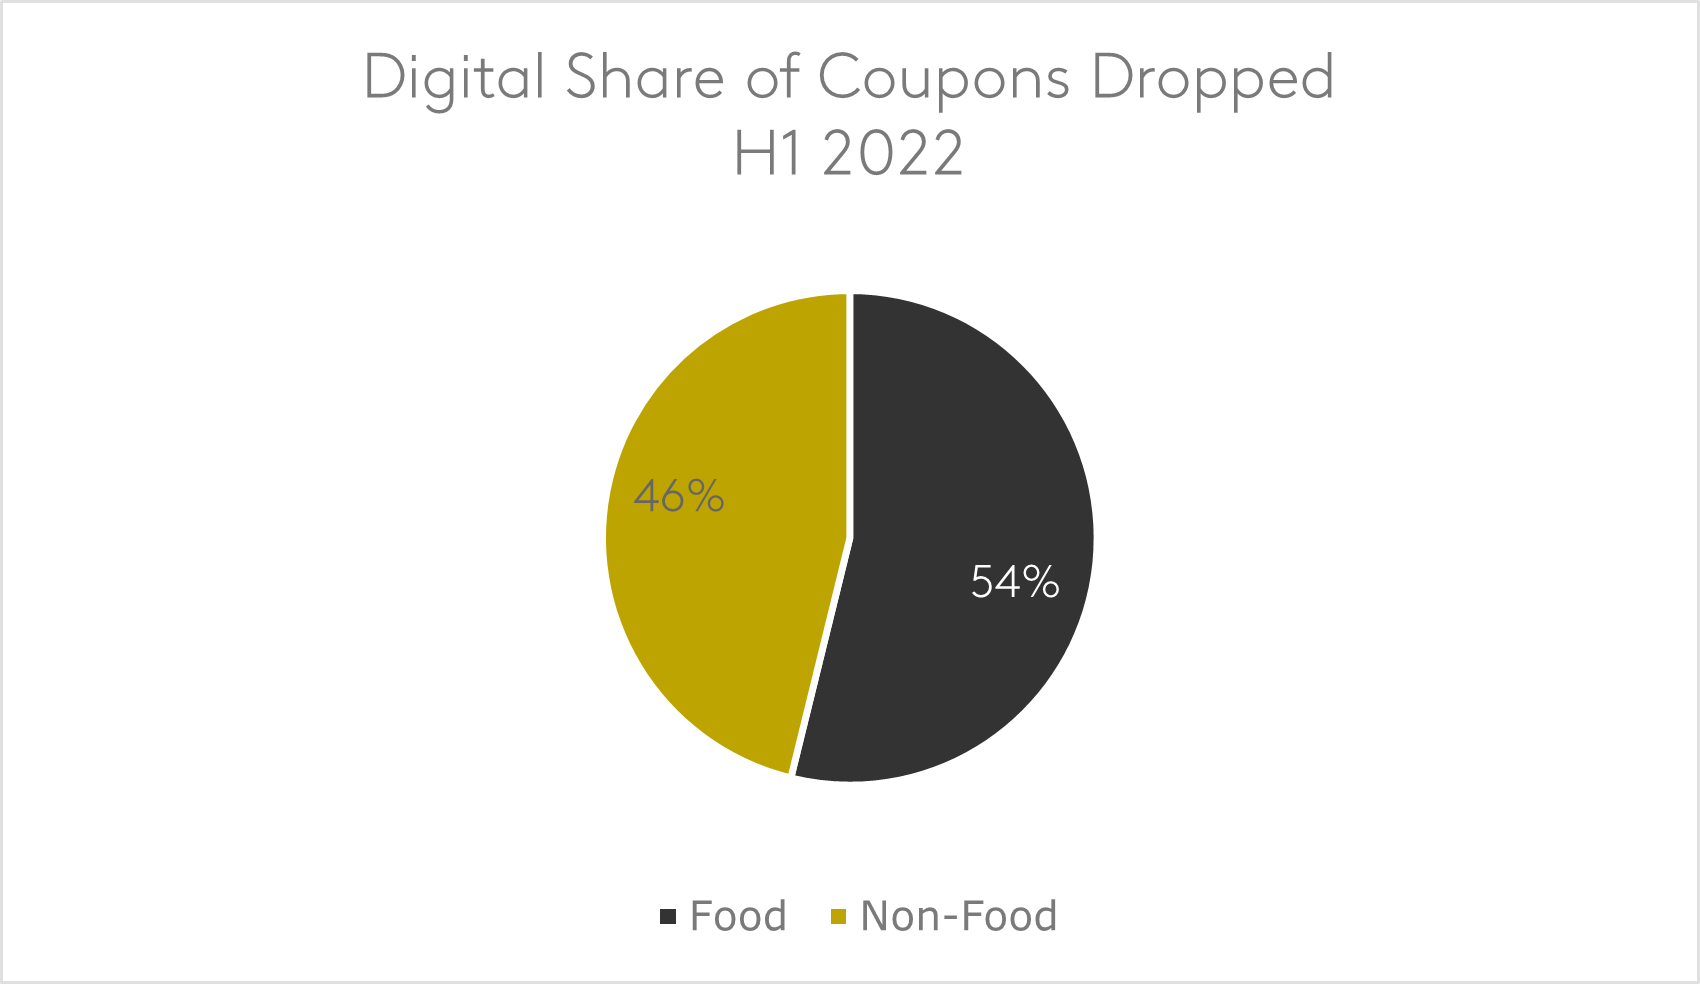
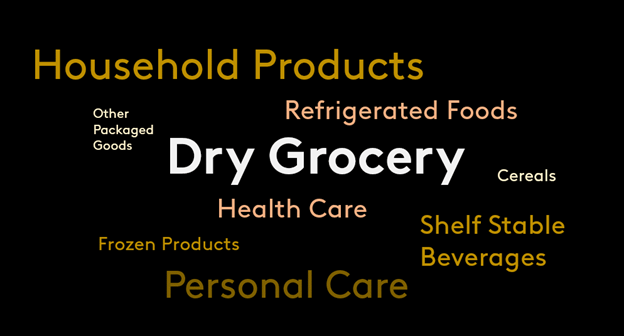
The overall reduction was driven by Food areas which saw a combined decrease in estimated prints of 15% vs. H1 2021. At the same time, Non-Food areas surged 13% and gained 7 share points vs. H1 2021 to account for 46% of total Digital estimated prints in an unexpected shift. While Dry Grocery remained the largest area for Digital estimated prints, the Non-Food categories of Household Products and Personal Care are now #2 and #3.
Health Care and Household Products saw the greatest year over year growth with Laundry Detergent increasing estimated prints by 12% to become the highest couponing product type in Digital.
January 2nd was the biggest Print drop week of H1 2022 driven by Health Care and Personal Care with an additional spike captured on May 1st. Digital activity peaked on January 9th and saw several similar activity spikes on February 6th, May 1st and June 5th – high activity weeks in the first half of H1 2022 were driven by Dry Grocery and Personal Care while later weeks were driven by Dry Grocery and Household Products.
What's it worth?
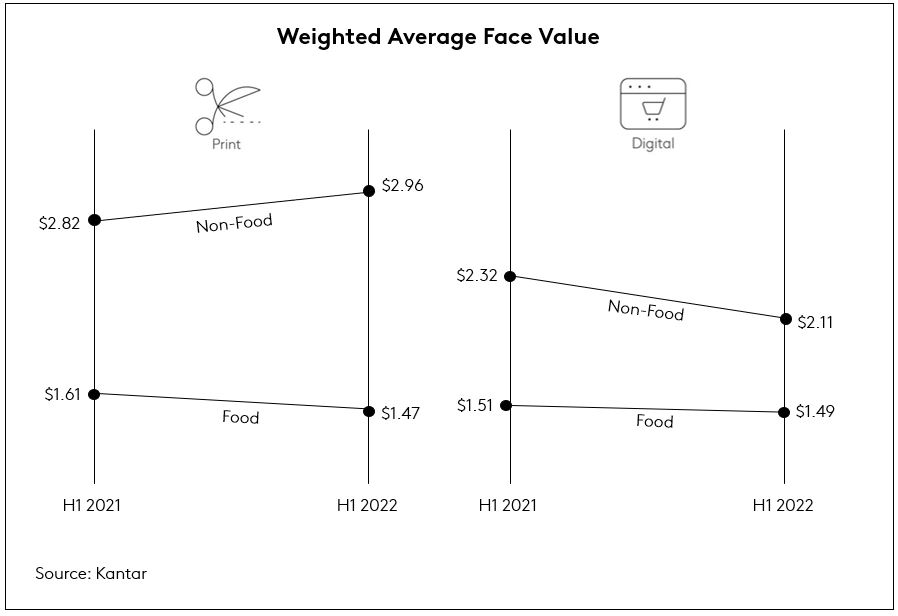
In H1 2022, Kantar saw Food manufacturers reduce Print coupon face values an average of $0.14 to $1.47 while Non-Food manufacturers increased incentives $0.14 to $2.96. The trend in Non-Food was driven by Health Care where Print face values rose $0.21 to $3.64 and Personal Care where Print face values rose $0.17 to $2.75.
In Digital, average Food face values decreased $0.02 to $1.49 while Non-Food face values decreased $0.12 to $2.11. However, there were two areas significantly increasing Digital incentives: Shelf Stable Beverages (+$0.13) and Personal Care (+$0.14).
New product support
So far in 2022, Kantar has captured over 900 new products in Print and Digital with Dry Grocery leading all other areas in total number of new products launched by a wide margin.
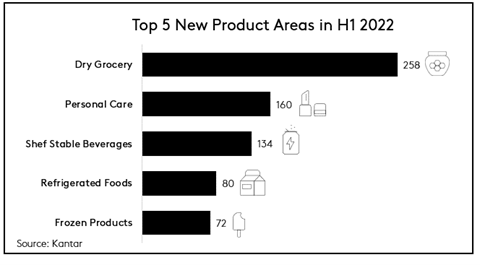
249 of these new Dry Grocery products were first seen in Digital, where manufacturers have increasingly turned to promote their new products. While Food areas continue to dominate the number of new products in Digital, Personal Care ranked #2 following a 6% year over year increase in new products first seen in Digital. Also worthy of note, the number of new Household Products captured in FSI coupons increased from 3 to 15 leading all areas in Print new product promotion in H1 2022.
Kantar measured an average number of 1.1 events that manufacturers ran in support of new Food products and 2.2 events in support of new Non-Food products in Print. In Digital, both Food and Non-Food averaged about 3 events per new product. In Print, Personal Care had the highest number of events per new product with 2.4 events, while in Digital, Cereal received significantly more support than other categories with an average of 6.9 events per new product.
Spotlight on unique digital offers
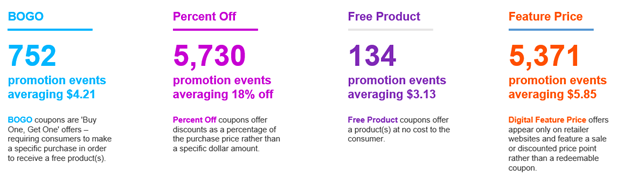
- BOGO: 752 promotion events averaging $4.21. The largest BOGO area was Dry Grocery with 330 promotion events, while the highest incentive BOGO area was Health Care averaging $9.31.
- Percent Off: 5,730 promotion events averaging 18% off. The largest Percent Off area was Dry Grocery with 1,370 promotion events, while the highest incentive Percent Off areas were Refrigerated Foods and Shelf Stable Beverages averaging 22% off.
- Free Product: 134 promotion events averaging $3.13. The largest Free Product area was Dry Grocery which saw 50 promotion events, while the highest incentive Free Product area was Health Care averaging $6.47.
- Digital Feature Price: 5,371 promotion events averaging $5.85. The largest Digital Feature Price area was Dry Grocery with 1,896 promotion events, while the lowest featured prices were found in Cereals averaging $2.68.
- Digital Rebates: Digital Rebates grew 26% to 552M estimated prints/clips and accounted for 11% of all Digital coupons in H1 2022.
Want to know more?
These insights are just the beginning of the visibility you can gain into promotional activity in your market and across your competitive set. For additional details, please fill out the form below: