

It’s a key question we face as market researchers: ‘How many survey responses is enough?’ In other words, what is a good survey response rate? For better or for worse, there is no clear answer. However, we offer recommended benchmarks as well as some tips for improving your survey response rate below.
What is a survey response rate?
A survey response rate is a measure of the percentage of people who complete a survey relative to the total number of panelists who were invited to participate.
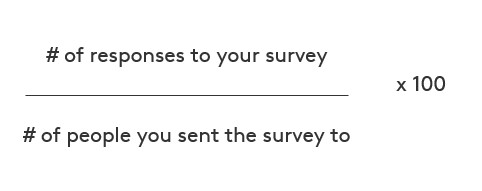
Response rates can be calculated by dividing the total number of completed responses by the total number of invited participants and multiplying the result by 100 to express it as a percentage. For example, if 500 people completed a survey out of 1,000 individuals who were invited, the response rate would be 50%.
This shouldn’t be confused with survey completion rate, which is the ratio of people who completed the survey out of the total number of people who started the survey. Not everyone who’s invited chooses to take part in the survey.
Survey response rates can be used to assess the representativeness of survey data. A high response rate, for example, indicates a greater likelihood that the sample is representative of the target population. This enhances the validity of the survey results. Comparatively, a low response rate could indicate potential biases and reduce the reliability of the findings.
What is a good survey response rate?
Exactly what constitutes a ‘good’ response rate can vary. But generally speaking, an acceptable survey response rate is between 5% and 30%. Anything above 30% is considered excellent.
Again, it is important to stress that there is no universally defined threshold for a ‘good’ response rate. Though market researchers should strive for higher responsiveness, response rates are heavily impacted by different factors, including target audience, survey length and design, quotas, how engaging the survey is, mobile friendliness, and even the day of the week the survey is distributed.
How the survey is distributed is a key factor as well. An invite at the right time and day, a well-placed ad on a relevant website, or a timely app notification are far more effective techniques than an instant blast of invites in the dark.
Why are survey response rates important?
Your survey response rate is a valuable metric because it directly reflects the quality of your data. More specifically, a high response rate indicates:
- Representativeness: A high response rate increases the likelihood that the survey sample accurately represents the target population.
- Reduced non-response bias: Non-response bias occurs when panelists are unwilling or unable to complete a survey. In response, the behaviors and opinions represented by the resulting data differ systematically from the behaviors and opinions of the target population.
- Increased statistical power: A higher response rate means a larger sample. This is good news for market researchers, since a larger sample reduces the margin of error and increases the precision of statistical inferences.
Simply put, a higher response rate allows market researchers to distill more meaningful and accurate insight from raw data. In return, brands can make data-driven decisions that resonate with consumers.
Building a Statistically Sound Sample
Accurate insights start with the right foundation. Before launching any research initiative, it’s essential to ensure your sample size is large enough to produce statistically valid results. Your ideal sample size depends on the total population, the level of precision required (margin of error), and your confidence level. The greater the need for precision, the more responses you’ll need.
Use a sample size calculator or reference table to guide your approach. For example, surveying 100 individuals from a population of 10,000 delivers a ±10% margin of error. Narrowing that to ±5% requires closer to 385 respondents.
Remember: your sample size refers to completed surveys, not just invitations sent. If you expect a 20% response rate, plan to contact five times the number of desired respondents. A well-calculated sample ensures the insights you gather are not only representative, but reliable—so you can move forward with confidence.
What affects your survey’s response rate?
Survey response rates are influenced by a bevy of factors. Some of these factors—a panelist's level of distraction, for instance—are difficult to control. However, many circumstances are controllable and can be manipulated to yield a higher response rate.
The survey itself
It’s common sense: A well-designed survey with clear and easy-to-understand questions, logical flow, and appropriate formatting will positively influence response rates. Conversely, poorly designed surveys will discourage participation and may lead to a dramatic impact on data quality.
With that in mind, here are some survey design elements to watch out for:
Survey type
The methodology used to survey will have a significant impact on survey response rates. Your target market and your target audience will highly influence what methodology is best suited. For example, the older population is well connected and easily reachable online in some markets, but not in others. In emerging markets, males tend to be more connected than females and rural audiences would be much harder to reach online.
Clarity of instructions
Clear instructions help respondents understand the purpose of the survey, the relevance of the questions, and how to provide appropriate answers. When instructions are confusing or ambiguous, respondents may get confused about what is being asked, leading to incorrect or incomplete responses.
Question wording
Similarly, the way questions are worded greatly impact panelists' ability to complete a survey and provide meaningful answers. If you use complex language or technical jargon, respondents may become confused and feel inclined to skip questions or abandon the survey altogether. Verbose questions can have a similar effect, leading to survey dropout.
Question type
Different types of questions require a different degree of effort. Open-ended questions, for example, yield rich qualitative data. However, these questions can be tedious and time-consuming, and if not presented strategically, can be less useful or a source of dropout. By the same token, matrix questions are appealing for the wrong reason. They do allow market researchers to gather a large amount of data from a single question, however, the length and complexity of matrix questions can be a turn-off for respondents and lead to poor quality. Think about it: 5 statements, 5 brands – that's already 25 questions in one!
Survey flow
Survey flow, or the sequence of survey questions, also impacts survey response rates. Surveys with a natural and logical order will yield higher response rates. For example, a well-designed questionnaire will ask a series of introductory questions to ‘warm up’ the participant before launching into sensitive or complex subjects.
Survey topic
The level of interest, relevance, and sensitivity associated with the survey topic influences respondents' motivation to participate and stay engaged throughout a survey. It’s a key challenge for many fast-moving consumer goods (FMCG) surveys since their subjects are often less exciting. Take toothpaste, as an example. Who truly likes to talk about it for 15 minutes? This again is why survey design is key for topics deemed boring by essence to collect meaningful data returns.
Survey length
The amount of time it takes a panelist to complete a survey is inversely correlated with their willingness to complete the survey. Put simply, shorter surveys—especially those that can be completed in 10 minutes or less—yield higher response rates.
The respondents
The characteristics of survey respondents can also have a significant impact on survey response rates. Different target populations have different preferences, barriers, and idiosyncrasies that affect their ability to complete questionnaires.
Some characteristics to be aware of include:
Motivation
A survey response rate is a direct reflection of panelists' willingness to complete a questionnaire. This willingness, or motivation, is affected by internal factors like altruism and social responsibility. But motivation is also affected by external factors like the incentives, rewards, and benefits you may offer in exchange for panelists' time.
When used thoughtfully, incentives can increase participation, particularly for longer surveys or harder-to-reach audiences. However, it’s important to avoid introducing bias, as overly broad or high-value rewards may attract the wrong respondents or influence the honesty of their answers.
Demographics
Demographic characteristics play a significant role in survey response rates. Younger individuals, for example, are not necessarily more inclined to complete an online survey than older people. However, it is highly dependent on a particular market demographics and technographics. For example, there is a technologic gender divide that should be taken into consideration in several emerging markets. Also, individuals from different ethnic and cultural groups may be more or less inclined to share personal information and sensitive to data privacy. Socioeconomic status also affects survey response rates and representation. As a market researcher, it is our responsibility to consider these factors and tailor questionnaires accordingly.
Recruitment methods
This factor is less related to the survey and audience targets and more related to how panel partners approach the recruitment process. It’s critical that panel owners use compliant, diverse and representative recruitment methods, as well as apply appropriate quality checks for the state of the panel industry today. If they don’t, you can expect fraudulent activity and lower survey response rates.
Engagement and interest
Besides finding your target audience, engagement is the overarching principle that influences response rates. It supersedes all factors presented previously: methodology, instructions, wording, question type, flow, topic, length and the respondents themselves. For example, a poorly written questionnaire with unengaging prompts and an inadequate user experience, even if short, will yield bad results. Outside of survey design choices, market segmentation can help with engagement, allowing market researchers to understand the interests of specific groups of consumers.
6 tips to increase your survey response rate
If you want to increase the validity and reliability of your survey data, you must increase your survey response rate. Here are six ways to do just that.
1. Start With a Strong Intro
Your introduction shapes the respondent's first impression. Clearly explain the purpose of the survey, how long it will take, and thank participants for their time. This helps build trust and encourages more people to begin and complete the survey.
2. Break up the monotony
To mitigate survey fatigue, spice up your survey with graphic elements like photos, symbols, and illustrations. When executed correctly, iconography can reduce panelists' mental load, helping them answer questions quickly and easily.
3. Test your survey
Before you send your survey to panelists, take it yourself or invite a small group of friends, family members, or colleagues to take it. In doing so, you can identify errors in the survey design, wording, question sequence, response options, and skip patterns. You also have a real sense of how engaging the survey is – or isn’t!
4. Make it engaging
No one wants to complete a boring survey. To make your surveys more engaging, apply mobile behaviors (swipe, tap) rather than mouse behavior (drag & drop, click, slide etc.). You should also consider your writing by using clear and concise language, use different types of questions and be mindful of introducing any kind of question or audience bias.
5. Keep it short
Less is always more in the survey world. As a general rule of thumb, an ideal survey length is 10 minutes or less. In other words, your questionnaire must be brief enough that the average participant can polish it off between meetings or while standing in line at the grocery store.
6. Avoid repetition
Given the short timeframe, you must make sure every question is meaningful. Redundant or superfluous questions will frustrate panelists, compromising your response rate.
7. Make it mobile friendly
Busier than ever, Kantar finds that 80%+ of people are completing surveys using mobile devices in many markets. If you don’t cater to these panelists, you can expect a miserably low response rate. Be mindful that “mobile friendly” doesn’t only mean “device or screen agnostic”, it means intuitive surveys designed with the intention of mobile completes.
8. Don’t overdo it
Frequent survey requests can lead to lower engagement over time. Focus on sending fewer, more targeted surveys that are relevant to the audience. This approach helps preserve respondent interest and trust.
9. Be thoughtful with timing
The timing of your survey distribution plays an important role in response rates. Consider when your audience is most likely to engage, such as weekday mornings or shortly after an interaction. Selecting the right time can significantly improve participation.
Increase your survey response rate with Kantar
Want to learn more about creating online surveys that yield high quality data? Subscribe below to receive market research tips on the first Thursday of each month. Our topics cover survey design, participant engagement, data enhancement, and more.