
Smartphone sales continue to decline, Worldpanel ComTech Smartphone Operating System (OS) data reveals. However the study reveals that the acceleration of decline is slowing. Global 3 month ending Smartphone volume sales to June 2023 are down -14%, an improvement on -20% the year prior. Total Smartphone ownership volumes have increased +2%.
Kantar Worldpanel’s Global OS study uncovers the following behaviors within the Global Smartphone market in Q2 2023:
- Google Pixel continues to score market leading sales share
- Oppo has lost sales share across all global markets. The greatest loss was registered in Japan, at -8% points year-on-year
- Oppo presents sizable churn risk. 4.6m global consumers predicted to churn in the next 6 months
- Apple iPhone 14 series continues to impress with strong sales share
- Samsung sales share are down across European 5 and US vs last year. S23 series begins to gain traction
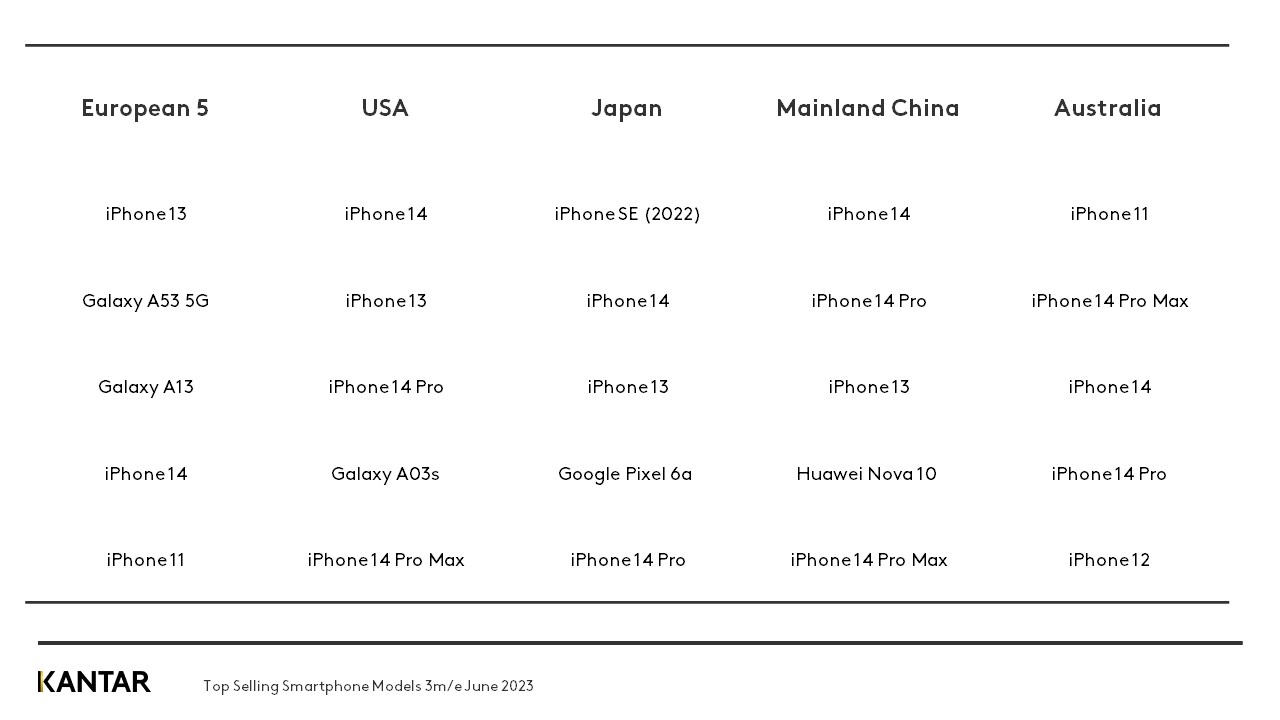
Across the European 5 markets, there are signs that Smartphone sales decline is slowing, dropping -1% year-on-year. Italy is driving stabilization with Smartphone sales up to their highest rate in two years. iOS sales share remains flat, whilst Android OS has experienced +1% uplift, driven by strong Google Pixel, Realme, Honor and Motorola performance. Conversely, Samsung has had a trying quarter, experiencing a -7% points decline in Android OS sales share compared to a year ago. Nevertheless, it remains the top selling Android manufacturer across the European 5.
In the United States, sales are down -3%, a further improvement on the -16% decline in the previous year. iOS has lost -2% points share vs 2022. iPhone 14 series continues its strong performance, and 14 and 14 Pro Max took first and second spot. Android OS sales are up +3% points. Google Pixel is driving this growth, accounting for a record 10% of all Android devices sold. Samsung face a challenging climate with -4% points decline in sales share. Despite this, it remains the top selling Android manufacturer with a record 62% share of sales. The Galaxy S23 is proving popular, taking third spot amongst the top selling models.
Across Asia Pacific, the picture is mixed. Australian Smartphone volumes are down -7%, a further decline vs 2022. iOS has had a strong quarter, +3% points share. The iPhone 14 series is driving this success, winning 14% share of all models sold. Android OS sales are down -3% points year-on-year. Across Android manufacturers, Google Pixel and Motorola have made strong year-on-year gains, +7% and 5% points respectively. Samsung remain the top selling Android manufacturer with 56% share. The S23 family is popular, accounting for 9% of all model sales.
Mainland China and Japan have experienced the greatest year-on-year decline in Smartphone sales, -25% and -20%, respectively. iOS has gained a strong share in Mainland China: +4% points compared to the same period in 2022. The iPhone 14 range is selling well, as is the n-1 iPhone 13, taking third spot in the top selling models. Android OS sales share is down -5% points year-on-year. The decline is attributed to a sharp drop in sales across domestic manufacturers; Xiaomi, Vivo and Oppo, this is being eaten by Huawei, Asus and Honor.
In Japan, consumers have turned to Android OS devices this quarter, with sales share up +8% vs 2022. Google and Samsung are driving these sales, +7% and +4% points respectively. Domestic brand Sharp continues to drive most Android sales. iOS has had a testing quarter, sales share down -8% points year-on-year. Despite this, iPhone accounts for the top 3 models sold. Consumers maintain an appetite for older devices; iPhone SE (2022) is the top selling model with the iPhone 13 ranking third.
Oppo’s retention obstacle
Oppo has faced a challenging quarter, experiencing a sharp drop in sales across all operating markets. It is a Chinese manufacturer, synonymous for lower-spend devices. Recently it has forayed into the premium space, notably with the launch of its Foldable, N Series range. The Find N2 was launched earlier this year, a flip foldable phone that housed a larger (3.6”) cover screen, the first on the market. Motorola and Samsung subsequently launched similar innovations in their latest razr+ and Z Flip 5 releases.
Using propensity modelling, a module in Kantar’s Advanced Analytics product suite, the likelihood of churn in the next 1-6 months can be accurately deduced from the characterization of behaviors derived from monthly continuous data feeds of longitudinal behavior. Globally, Oppo has the highest probability of churn with 60% of owners demonstrating characteristics synonymous with churn behavior. This is driven by European markets, Germany, France, and Italy. This compounds Oppo’s current European challenges, with rumors that they are set to pull out of the continent following a series of patent lawsuits.
Among Oppo’s flight risk consumers, Samsung is set to be the biggest beneficiary. Oppo likely churners are price conscious; 46% cite “price is important to me” and 37% say “I spend within a given price”. These consumers are less likely to spend more for quality and are less interested in trying new things. They are also less engaged with Smartphones with just 10% agreeing that they are “first to buy a new phone” and 75% agree that they keep their smartphones for a long time. Despite being less engaged with the category this group are still worth 4.6M in global volume sales; for Oppo it is important to protect them from churning, but for competitors they are a low hanging opportunity group to steal.