
The streaming market continued its evolution in the first quarter of 2022. Entertainment on Demand, our solution measuring streaming service, reveals the following subscriber behaviors in the U.S. for the first quarter of 2022:
- The proportion of U.S. households who have video streaming services has stalled at 86% (up 0.4% points quarter-on-quarter), after seeing substantial growth in the fourth quarter of 2021. This means there are now 110.2 million households accessing streaming services, as of March 2022.
- While flat overall, there are growth differences across the streaming tiers. SVoD (paid streaming without ads) is down 0.2% points to 81.4%, while AVoD (paid ad-supported streaming) grew by 2.2% points to 20.2% household penetration. FAST (free, ad supported streaming) grew by 0.9% points to 25.3%.
- While AVoD and FAST streaming continues to grow, their growth slowed compared to their rapid growth in previous quarters.
- Live Pay-TV is flat, continuing to have 60% of U.S. household penetration
- 8% of U.S. households accessed a new service in the first quarter, down from 9% in the fourth quarter of 2021.
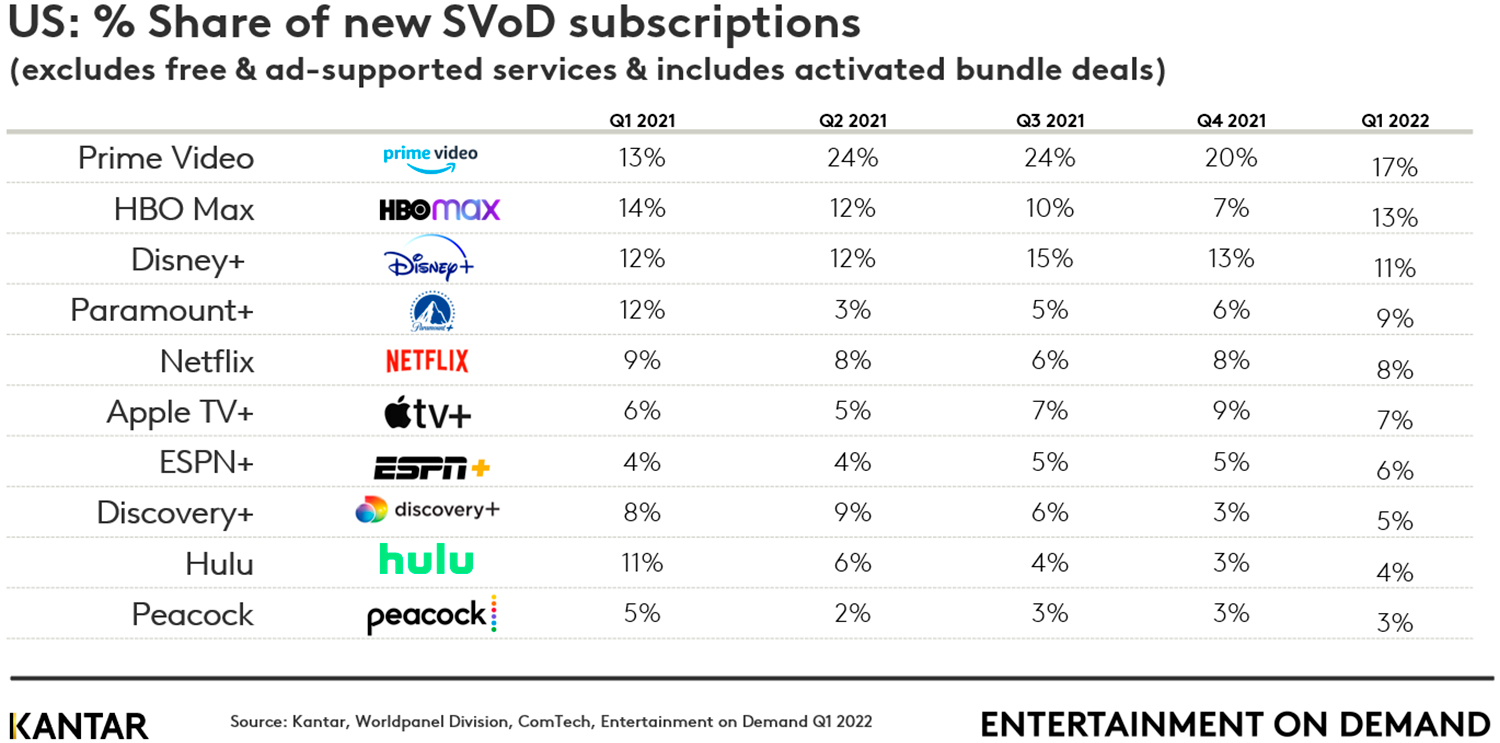
- Amazon Prime Video is the top destination for new SVoD subscribers for the fourth consecutive quarter, but its share is down 3% points quarter-on-quarter. HBO Max and Paramount+ saw the greatest rise in share of new subscribers up to 12% and 9% respectively.
- Netflix subscribers continue to shrink for the fifth consecutive quarter, seeing a decline in household penetration of 0.2% points quarter-on-quarter. This is a decline of 4 percentage points year-on-year.
- At a time when total SVoD is flat, content is still helping drive growth. Titles like 1883 on Paramount+, The Mandalorian on Disney+, and Ted Lasso on Apple TV+ are driving content-based sign up.
- After continued growth in previous quarters, stacking has finally leveled off. The average household is accessing 4.7 services, unchanged quarter-on-quarter.
- Overall, the US may have reached peak stacking. Expect to see a greater rate of churn and switching as consumers are more selective about what they watch. For streaming platforms, now is the time to ensure they keep streamers engaged after they finish a piece of content through their easily navigable interface and content recommendations. As with CNN+, it may be more challenging for newer entrants to justify their value within the saturated market. Expect to see more value driven price points to prevent cancellations, like Netflix’s consideration of a more affordable, ad-based option. Despite these challenges, U.S. streamers are not leaving the streaming category.
Now is the time to diversify growth strategies and fine tune competitive advantages to retain and win new streamers.
Peak stacking reached & decision paralysis
Stacking has levelled off in the first quarter, seeing no growth in the average number of streaming services accessed per household. Across total streaming the average number remains 4.7 services, unchanged vs the fourth quarter. Within paid streaming, consumers are accessing 3.7 services per household, also unchanged vs the fourth quarter. As indicated by the stable penetration of streaming, the leveling off of stacking also indicates the US is not cutting streaming as seen in other countries (i.e., the UK, driven by the economy). It still has an important role in US households. Drivers of cancellation in the first quarter provide further insight. Cancellation of a streaming platform in order to save money remains the single largest driver, but this is unchanged versus the fourth quarter. While the rising costs of goods across the globe are leading to cost cutting, streaming is more of an inelastic expense in the U.S. The U.S. may have reached a point of content saturation instead. With so much choice, consumers are finding it harder to find content they want to watch.
Key drivers of cancellation in Q1
It’s becoming harder for streamers to find content they want to watch, and they’re increasingly signing up then subsequently cancelling services after watching a specific piece of content. In addition, planned cancellations going into the second quarter of this year are increasingly driven by not enough new TV/film content. The major exception to this is Netflix, which is driving actual and future cancellation with price increases. Netflix’s price increase drove 15% of its cancelled subscriptions in the first quarter (vs 9% industry average) and 29% of planned cancellation in the second quarter (vs 18% industry average).
Decision paralysis with viewership
If the U.S. has reached the point of too much choice, making it harder to find engaging content, we can expect to see more switching between platforms instead of more stacking. As such, we can expect to see viewers increasingly signing up and cancelling for specific content. This means platforms need to heavily market and recommend specific titles as opposed to broader platform catalogues to help consumers with decision paralysis.
Price still plays a role
Although the stagnation of overall streaming can be attributed to content factors, it is evident price still plays a role in streaming. Both AVOD (paid ad-supported streaming) and FAST (free ad-supported streaming) grew in penetration in Q1’22, while SVoD was flat. This indicates consumers are thinking more about the value for money per subscription and making ad-supported choices to get the best perceived value. As we’ve seen with stacking, if consumers don’t see the value in the content they are paying for, they will no longer subscribe to additional platforms at a higher cost. Instead, we’ve seen the lower cost or free options are driving growth of the streaming category. Yet the growth of AVoD and FAST significantly slowed in the first quarter.
AVoD grew by roughly 1% point quarter-on-quarter and FAST by 2 percentage points quarter-on-quarter. This is a sharp decline from their Q4’21 growth of 4 percentage points for AVoD and 5 percentage points for FAST. Any negative economic impact on streaming would be expected to further drive the growth of the lower priced options instead of slowing their growth. This further indicates the inelasticity of streaming within the U.S. household compared to other global markets.
On a platform basis, there are exceptions to the stagnation of SVoD at the expense of AVoD and FAST. Both HBO Max and Paramount+ saw greater growth of their SVoD tiers than their AVoD tiers. Peacock SVoD saw greater growth than Peacock FAST. These may be driving trade-up from lower-tiers meaning they are proving their value and providing engaging content to their subscribers.
Case study: Paramount+
Paramount+, still one of the younger platforms on the market, is demonstrating how a single title can drive growth. Paramount+ SVoD grew by 20% in the first quarter, compared to 17% in the fourth quarter of 2021. Its AVoD tier shrank 1% in the first quarter, after nearly doubling in size in the previous quarter. New sign-ups for Paramount+ SVOD are primarily driven by specific content. Specific content drove 64% of their SVOD sign ups, compared to the SVoD average of 37%. For Paramount+ SVoD, the content driving growth is 1883 (accounting for 35% of new SVoD signups for specific content) and the Star Trek franchise (accounting for 16% of new signups for specific content). They also over-indexed on their variety of TV series, which drove 20% of new sign-ups for SVoD, compared to the SVoD average of 16%.
Although it’s SVOD driving growth of the platform, Paramount+ is driving satisfaction among its existing AVoD users. In Q4’21, Paramount+ AVoD had an NPS score of 22, well behind the AVoD average of 37. In Q1’22, Paramount+ AVoD has closed the gap, bringing their NPS up 10 points, while the AVoD average dropped 3 points. This indicates they can expect fewer AVoD cancellations going into Q2’22 if they can keep their current subscribers happy. It also represents a trade-up opportunity to SVoD if they can demonstrate incremental value moving up a tier.
Paramount+ AVoD has improved two factors that has driven subscriber satisfaction. The first is the amount of original content. Original content is driving satisfaction among 38% of their subscriptions, up 6% points quarter-on-quarter. The second is their ease of use. This drives satisfaction among 43% of their subscriptions, up 7% points quarter-on-quarter. This highlights how integral interface is to driving content engagement across platforms.
Streamers that struggle to use a platform interface find it harder to discover content and therefore are at greater risk of churn. Similarly, this will be important for Paramount+ SVoD as a key tool to keep viewers engaged after they’ve watched the single title they signed up for. Otherwise, they risk high churn as streamers move on to different content on other platforms.
Case study: The value of bundling: Disney+ / Hulu/ ESPN+
Household penetration of Disney+ grew 2% in the first quarter to reach 24% of U.S. households. While positive, this is down from its growth of 7% in the fourth quarter. Similarly, Hulu grew by 2% quarter-on-quarter (to 28%) and ESPN+ by 1% quarter-on-quarter (to 6%). Due to the Disney+, Hulu, ESPN+ bundle, the performance of these three platforms is highly linked. Of all Disney+ bundles, 34% of them are the Hulu-ESPN+ bundle, down from 38% in the fourth quarter.
When looking across all three platforms, it appears that ESPN+ is impacting the perceived value of the bundle. First looking at NPS, both Disney+ and Hulu retained their high NPS score quarter-on-quarter while the SVoD category NPS dropped 4 points. ESPN+, on the other hand, dropped its NPS 9 points to a score of 29, compared to the SVoD average of 42, Disney+ score of 45, and Hulu score of 48.
Comparing drivers of satisfaction, it's evident both Disney+ and Hulu perform well on content such as variety of classic films and children’s content for Disney+ and variety of TV series for Hulu. Because ESPN+ is sports focused, sports content is the viable area to drive satisfaction.
Comparing drivers of dissatisfaction, ESPN+ sticks out on interface and ease of use. This creates a double impact of lacking in content variety and a poor interface. Paramount+ AVoD illustrated the importance of interface to driving content engagement. With ESPN+ lacking in both areas, it becomes evident that this will have a broader impact on the ESPN+ platform as well as the Disney+ trilogy bundle. To prove the value of the trilogy bundle, Disney+, Hulu, and ESPN+ need to ensure they are individually providing sufficient value and choices to streamers in the home. Otherwise, expect sign ups through this bundle to slow as consumer are increasingly reevaluating what platforms they subscribe to.
Netflix: Finding new ways to meet the consumer
Netflix's move seems inevitable as the streaming landscape shifts into its next phase. The company's earnings report of disappointing numbers demonstrates that new viewing strategies are inevitable. Ones driven by SVoD that are less-costly, bundled and offset by ad-supported plans may be the viable pivot to make. Despite the challenges of rolling out an ad-supported tier, the move could be a key component of Netflix getting back on track.
While Netflix was expected to meet or exceed its projected first quarter subscriber gains, our EoD first quarter data presented a different outlook prior to their earnings call: Netflix’s U.S. penetration was down 0.3%, following a 0.5% decline in the previous quarter.
The primary new contributors to Netflix’s recent decline and SVoD slowdown are: more players driving increased content competition within the SVoD sector, combined with more content choices, at lower cost, from the ad-supported video-on-demand (AVoD) sector. The market appears to be reaching a tipping point at which consumers are unwilling to take on more streaming services because of the difficulty of finding content amid too many choices.
Saving money is still the number one reason for cancellation, but it has not significantly driven a greater proportion of cancellations this quarter for the total market. Instead, it is content that is more likely to drive cancellation compared to the fourth quarter: either wanting to watch a specific series/film and then cancelling or it being hard to find content to watch. Netflix is unique in that its price increase of $1.50 had a significant impact on cancellations this quarter. As streamers evaluate the available content and value they receive from their streaming repertoire, Netflix is seeing losses.
Netflix is an example of how a mature platform can see increased churn. Other platforms can learn from Netflix and focus on their strategies to prevent churn by driving viewer engagement, while simultaneously strategizing to win streamers expected to churn from competitors. The trends seen with Netflix are a sign of larger shifts in the market, and a turning point from continued stacking and increased spend.
Access the interactive data visualization for more information.