The latest grocery market share figures, published today by Kantar, show supermarket sales grew by 1.4% year on year during the 12 weeks to 16 June 2019. This marks a new milestone for the sector, which is celebrating a three-year trajectory of continuous growth dating back to July 2016.
The modest level of current growth is thanks in no small part to the wet start to the summer, with last year’s heatwave and the run up to the men’s FIFA World Cup making 2018 a difficult year to top. These challenges are reflected in typical summer categories: in the past four weeks sales of ice cream were £15 million lower than this time last year, while beer is down £17 million and burgers £6 million.
However, even unseasonable clouds have a silver lining. Shoppers sought refuge from the cooler weather and spent more on traditional comfort foods, with fresh and tinned soup sales up by 8% and 16% respectively.
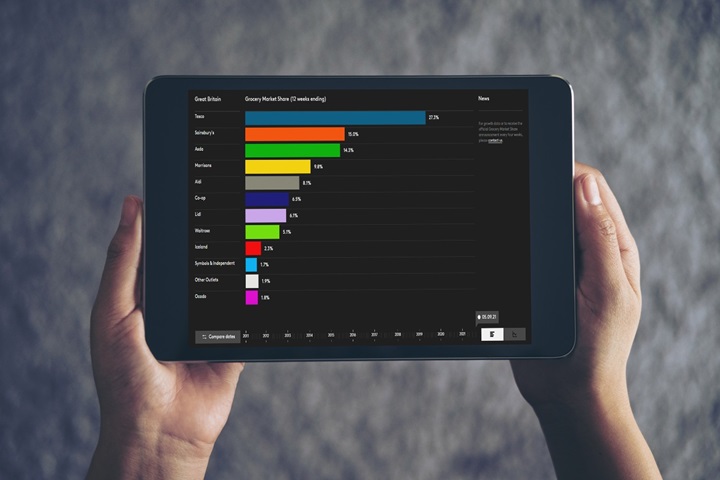
Aldi attracted an additional 883,000 shoppers through its doors this 12 week period, with sales up 9.3%. This helped the retailer to grow its market share to 7.9%, up by 0.5 percentage points on one year ago. Aldi’s announcement that it is rolling out more small, ‘Local’ format stores in London looks like an attempt to increase its share in the capital, where it currently takes home just one out of every £30 of supermarket spend. Grocery sales growth in London currently stands at 4% year on year, nearly three times the national rate, showing why all retailers see the capital as a major area of potential.
Rival discounter Lidl, having recently announced plans for a flagship store on Tottenham Court Road in central London, also has eyes on the capital’s convenience market. However, Lidl’s current ‘Big on the Big Shop’ advertising campaign is focused on increasing the number of large shopping trips it attracts. Nearly two-thirds of its current growth is from shoppers spending more than £25 in one go, and Lidl clearly sees value in encouraging a weekly shop. Overall the retailer enjoyed another strong period, with sales up by 7.5%, lifting its market share to 5.7%.
Growing by 3.0%, Co-op also increased its market share, now commanding 6.2% of British grocery sales. Co-op is continuing to enjoy success in London and the South, where new store openings have helped make the region its largest area of growth. The convenience retailer already boasts the highest shopper frequency in the market as customers regularly pop in for smaller baskets and this has increased even further in the latest period: the average shopper stopped by 22 times over the course of 12 weeks.
Online specialist Ocado was the UK’s fastest growing supermarket, with sales growth of 11.3% comfortably ahead of the overall e-commerce market at 6%. However, only 3% of British shoppers currently buy from the retailer, something it will be looking to build on when it begins to stock M&S products next year. The remaining retailer to enjoy growth this period was Iceland, with sales up by 0.6%, although its market share slipped by 0.1 percentage points to 2.1%.
Tesco sales were flat year-on-year despite an increase in volumes sold. This was caused by the average price paid per pack falling as sales of its value own label lines like Eastman’s and Redmere Farms increased by 11%, and its ‘100 Years of Great Value’ campaign continued to offer lower prices. Tesco remained the country’s largest retailer, although its market share fell by 0.4 percentage points to 27.3%.
Sainsbury’s saw its sales fall by 0.6% in the latest 12 weeks, halving the rate of decline it registered last month. This is because of an increase in the number of affluent consumers visiting the retailer, with ‘AB’ shoppers increasing spend by 2% this period. The rise in wealthier shoppers bodes well for Sainsbury’s and its plans to shake up its fresh offer, which will place more emphasis on counters, bakeries and food to go. The retailer will be hoping this provides another reason for shoppers to visit.
Meanwhile, Asda’s sales fell by 0.1% though it will be buoyed by the performance of its online arm, which enjoyed double-digit growth of 10%. Asda’s share of the overall market fell by 0.2 percentage points to 14.9%, while Morrisons’ sales decreased by 0.5%, lowering its share to 10.4% of grocery sales.
Waitrose’s share this period slipped back by 0.1 percentage points to 5.0%, with sales remaining flat compared to a year ago. Waitrose received good publicity this month for its trial of packaging-free goods in one of its Oxford stores, where shoppers were encouraged to bring their own containers. Six per cent of the retailer’s sales are already sold loose, a greater proportion than any of its rivals, showing an appetite for more sustainable packaging among its customers.
Notes for editors
Please note that four week ending or six week ending retailer share data should not be used in media reporting. The 12 week ending data stated in this release covers a longer time period which means it is a superior indicator of retailer performances and trends.
These findings are based on Worldpanel FMCG data for the 12 weeks to 16 June 2019. Kantar monitors the take home grocery purchasing habits of 30,000 demographically representative households across Great Britain. Kantar grocery market share data includes all expenditure through store tills, excluding petrol and in-store concessions. All data discussed in the above announcement is based on the value of items being bought by these consumers.
Every year we review and rework our dataset to ensure that it remains the best and most accurate read of the grocery market. This has been updated in the latest period, with a slight impact on retailer shares. Period-on-period growth trends remain unaffected as historic data has been reworked for consistency.
For reworked 12 w/e historical data please contact Camargue – figures released prior to 25 June 2019 should no longer be used.
For all publicly-quoted data, users of our research (including media) must ensure that data is sourced to ‘Kantar’.
Retailer growth figures reported by Kantar relate to overall take home sales, and so include the impact of store openings or closures. Like-for-like sales change is not measured or reported. Calculating like-for-like sales requires a detailed knowledge of store openings and extensions which is information held accurately only by individual retailers.
Kantar will only support data that is published in the context we have presented it and our own interpretation of these findings. Our commentary is based upon our own data and information in the public domain. We cannot be held responsible for any other interpretation of these findings.
An update on inflation:
Grocery inflation now stands at 1.0%† for the 12-week period ending 16 June 2019. Prices have been rising since the 12 weeks to 1 January 2017, following a period of grocery price deflation which ran for 30 consecutive periods from September 2014 to December 2016. Prices are rising fastest in markets such as crisps, bottled cola and dog food, while falling in instant coffee, fresh bacon and detergents.
† This figure is based on over 75,000 identical products compared year-on-year in the proportions purchased by shoppers and therefore represents the most authoritative figure currently available. It is a ‘pure’ inflation measure in that shopping behaviour is held constant between the two comparison periods – shoppers are likely to achieve a lower personal inflation rate if they trade down or seek out more offers.


