
Our latest figures show that take-home grocery sales in Ireland increased by 3.6% in the 12 weeks to 3 October 2022, as grocery price inflation hit a record high of 12.4%.
In the latest 12 weeks, an 8.6% increase in price per pack saw shoppers spend an additional €99.1m compared to the same period last year, while the number of shopping trips also increased 3.8%. Over the last four weeks the average price per pack increased by 8.7%. The rising cost of everyday essentials is hitting shoppers particularly hard, with the average price per pack of staples like butter, milk and bread, is now 28% higher than this time last year.
Grocery price inflation is the highest level seen since Kantar started tracking the data. As food and drink prices continue to climb alongside other financial pressures, 32% of shoppers in Ireland admit they are ‘struggling’ to make ends meet, a figure that has increased from 23% in March of this year. The average annual grocery bill will go from €6,999 to €7,867 if consumers don’t make any changes to what they buy and how they shop to cut costs. This means the average annual shop is set to rise by €868 a year. At a basket level, that’s an extra €3.36 per trip.
As consumers change their shopping behaviour to deal with the extra pressures on household budgets, supermarket own-label ranges are benefitting. The sales of retailer own-label lines jumped 7.2% in the latest 12 weeks with shoppers spending an additional €88.3m year-on-year. Value own-label ranges saw the strongest growth, up 23.5% year-on-year with shoppers spending an additional €11.3m.
In contrast, online sales saw a decline for the first time since March 2022, with shoppers decreasing their trips online by 5.5% and replacing that with trips to physical stores instead (+5.5%). In the last four weeks, online visits were down 3% and volumes fell by 6.4% with 1.8% of shoppers leaving the online platform in October.
Category increases led by Halloween treats
As household budgets tighten, shoppers are looking to their food and drink spend for small luxuries to enjoy in home. As a result, in the last 12 weeks, sales of branded take home soft drinks, chocolate biscuit bars and crisps jumped 5.4%, 10.9% and 6.5% respectively. Overall, branded goods saw slight growth in the same period, up 0.7% with shoppers spending an additional €9.2m.
As ‘trick or treat’ season approaches, shoppers are preparing for Halloween festivities. Sales of pumpkins soared 24% year-on-year with shoppers spending an additional €1.3m on sugar confectionery and €816,000 on chocolate confectionery.
Retailers’ own-label and loyalty schemes drive growth
Retailers in Ireland continue to respond to consumer demand for value with strong loyalty card or voucher offers and increased emphasis on own-label ranges.
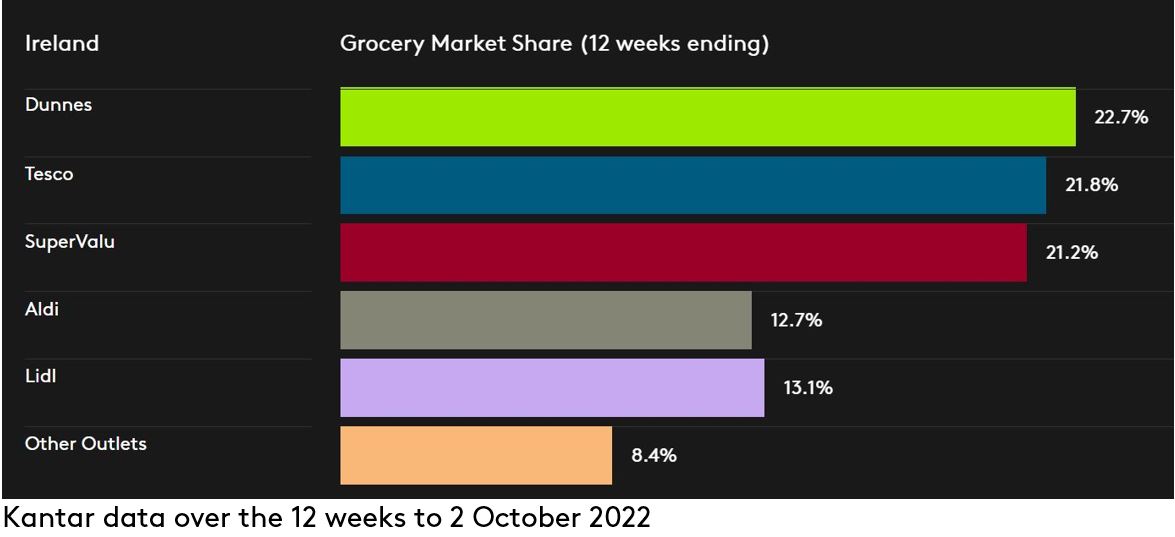
Among all the retailers in the Irish grocery market, Dunnes has the highest share with 22.7% and growth of 8.2% year-on-year. This growth stems from an influx of new shoppers, up 5.3%, which contributed an additional €32.3m to their performance.
Tesco holds 21.8% of the market with growth of 5.2% year-on-year thanks to an 8.9% increase in shoppers returning to store more often. SuperValu holds 21.2% of the market and continues to see shoppers make the most trips in-store when compared to all retailers, with an average of 21.2 trips per year, up 3.5% year-on-year.
Lidl holds 13.1% share with growth of 5.6% year-on-year. New shoppers contributed an additional €11.8m to their performance, alongside existing shoppers returning more often. Aldi holds 12.7% of the market with growth of 2.4% year-on-year.