The latest figures from Kantar show the grocery market grew by 1.3% during the 12 weeks to 19 May 2019, as the memory of a record-breaking May 2018 looms large over retailers.
This time last year we experienced the hottest May since records began and enjoyed major events like the royal wedding and FA Cup final – so we would expect this period to be challenging for all grocers when comparing year-on-year performance. Sales of beer and lager, ice cream and sun care fell by 7%, 12% and 16% respectively during the past four weeks as cooler weather impacted discretionary spending.
Growth of 1.3% may appear modest when compared with last year’s 2.7%; however, the sector continues to demonstrate resilience and volume sales remain unchanged from last year. We have two European football finals with British interest, the Cricket World Cup and the FIFA Women’s World Cup to look forward to in the coming weeks. Retailers will be aiming to capitalise on these events and attract more shoppers throughout summer.
Aldi and Lidl are worth a collective £344 million more than this time last year and reached a combined record market share of 13.8% this period. The discounters continue to attract customers with nearly one million more households visiting Aldi compared with last year and an additional 630,000 shopping at Lidl. Around 75% of growth at both supermarkets is coming from the ambient and chilled aisles as people opt for value in a greater proportion of their basket.
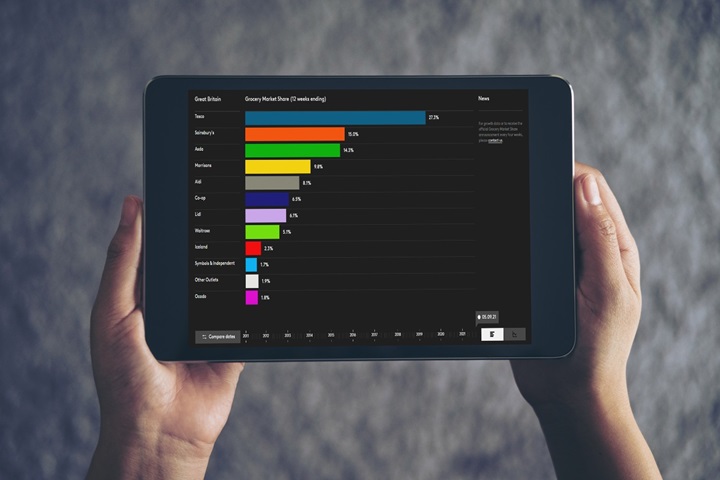
Tesco recorded market share of 27.3% and sales were supported by the performance of its own label ranges. While Tesco’s overall sales were flat, its performance was the strongest out of the big four during the past 12 weeks. Exclusively at Tesco products continue to be popular and went home in a quarter of customers’ baskets while discounts linked to the retailer’s ‘100 years of value’ campaign delivered a further boost. Looking ahead, the supermarket will be hoping the decision to make lines from its Jack’s discount arm available in store throughout May will pique customers’ interest and generate incremental sales.
Waitrose experienced marginal growth of 0.1% during this period and its new Good Health range is one of the fastest growing own label lines across the major retailers, with sales totalling £13.4 million. The supermarket’s large proportion of AB customers is driving this growth as they increasingly look to make healthier choices.
Aside from Aldi and Lidl, Co-op delivered the strongest bricks-and-mortar sales growth of 3.7%. Shoppers are clearly enjoying their experience in store at Co-op and have increased their number of trips by 5% in the past 12 weeks. New promotions like its frozen meal deal have also proved popular at the convenience store and sales of frozen pizza and frozen chips are up 27% and 24% respectively during the past 12 weeks.
Sainsbury’s market share has fallen 0.5 percentage points to 15.2% as it nears its 150th birthday. Sainsbury’s is approaching its own anniversary a bit differently from rival Tesco – as well as reflecting on the past 150 years and including the Queen in celebrations, it is also looking forward and championing smaller brands with its Future Brands initiative. Sainsbury’s will be hoping that this strategy, combined with an increased level of promotions in recent months, will help win shoppers back.
With the CMA ruling against the proposed merger now behind them, Asda and Sainsbury’s are neck and neck in the number two position this period as overall sales at Asda fell 0.2% despite online growth of 10.7%. Meanwhile, Morrisons remains Britain’s fourth largest supermarket with market share of 10.4% down from 10.5% this time last year.
Ocado increased its market share to 1.3% as Iceland holds steady at 2.1%, making good use of Y for £X deals. Sales through promotion at Iceland are marginally higher than this time last year, accounting for 32% of overall grocery spend. However, the retailer has created more innovative meal deals, often offering a free component rather than a cash or volume discount to entice shoppers and increase overall volume spend.
Notes for editors
Please note that four week ending or six week ending retailer share data should not be used in media reporting. The 12 week ending data stated in this release covers a longer time period which means it is a superior indicator of retailer performances and trends.
These findings are based on Worldpanel FMCG data for the 12 weeks to 19 May 2019. Kantar monitors the take home grocery purchasing habits of 30,000 demographically representative households across Great Britain. Kantar grocery market share data includes all expenditure through store tills, excluding petrol and in-store concessions. All data discussed in the above announcement is based on the value of items being bought by these consumers.
Retailer growth figures reported by Kantar relate to overall take home sales, and so include the impact of store openings or closures. Like-for-like sales change is not measured or reported. Calculating like-for-like sales requires a detailed knowledge of store openings and extensions which is information held accurately only by individual retailers.
Kantar will only support data that is published in the context we have presented it and our own interpretation of these findings. Our commentary is based upon our own data and information in the public domain. We cannot be held responsible for any other interpretation of these findings.
An update on inflation: Grocery inflation now stands at 1.2%† for the 12-week period ending 19 May 2019. Prices have been rising since the 12 weeks to 1 January 2017, following a period of grocery price deflation which ran for 30 consecutive periods from September 2014 to December 2016. Prices are rising fastest in markets such as cola, dog food and crisps, while falling in instant coffee, bacon and nuts. † This figure is based on over 75,000 identical products compared year-on-year in the proportions purchased by shoppers and therefore represents the most authoritative figure currently available. It is a ‘pure’ inflation measure in that shopping behaviour is held constant between the two comparison periods – shoppers are likely to achieve a lower personal inflation rate if they trade down or seek out more offers.