
Kantar’s Entertainment on Demand study in the US uncovers the following behaviors within the VoD market over the 3 months to December 2022:
- From September to December 2022, the number of households with video streaming rose 2.5 million, reaching a total of 115.6M households. Household penetration of video streaming is now 89%.
- Stacking continues to climb, with the average household accessing 5.4 different streaming services, up from 5.2 in Q3’22.
- 7% of US households used a new streaming service in Q4’22, up from 6% in Q3.
- With the introduction of both Netflix AVOD (paid, ad-supported video on demand) and Disney+ AVOD, the AVOD category is now the fastest growing in streaming, followed by FAST (free, ad-supported video on demand). SVOD (paid video on demand without ads) has declined for the second straight quarter, losing nearly 0.8M subscribers in Q4’22.
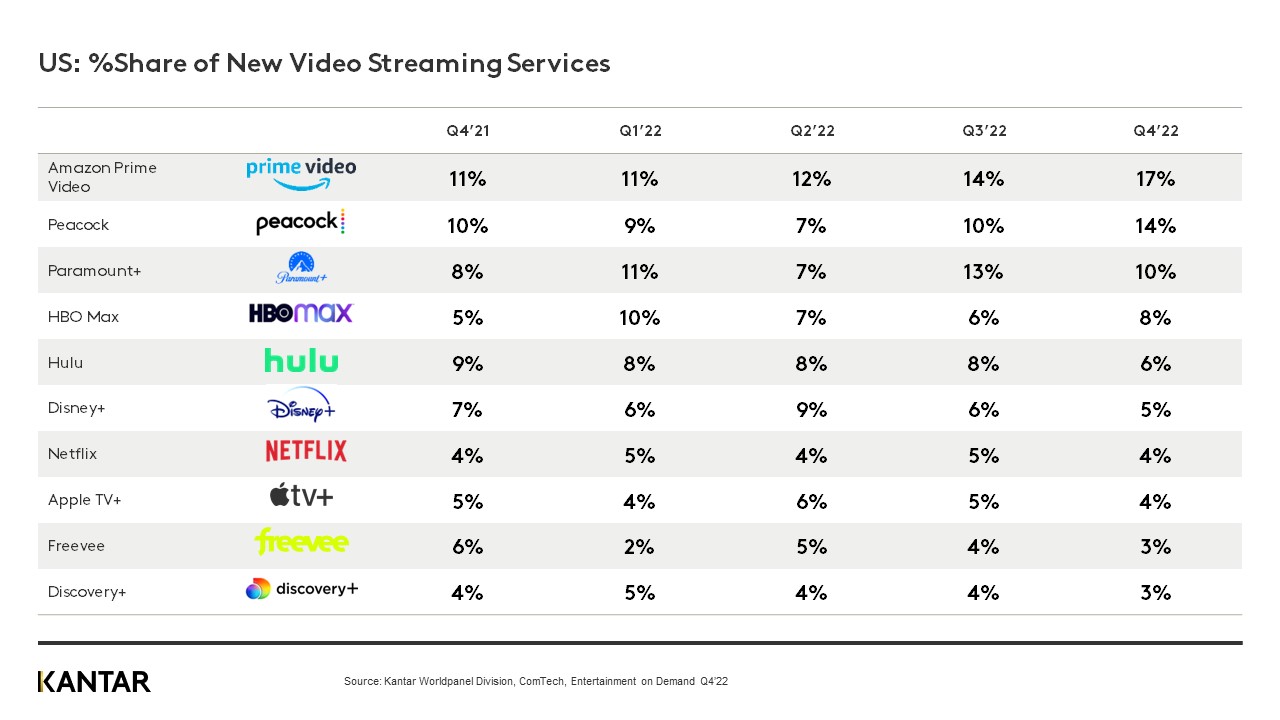
- Among new services used in Q4’22, Amazon Prime Video, Peacock, and Paramount+ had the largest gains.
- The NFL season helped drive sign up for sports content in the last quarter. Sports events/matches drove 9% of all new streaming services in Q4, its highest impact yet.
- Yellowstone (purchased episodically on Prime Video or streamed on Peacock), House of the Dragon on HBO Max, and Wednesday on Netflix were the three most enjoyed titles in Q4’22.
- Planned cancellation over the next 3 months continues to be at 5% of subscriptions (NC quarter on quarter), but AVOD subscribers have the highest rate of planned cancellation, indicative of this group’s higher propensity to boomerang between streaming services.
US Streaming back to growth
In Q3’22, the US streaming category contracted, driven by just 3 services. Streaming is now back to growth in Q4, again with all but three streaming services growing their subscriber base. Total Streaming grew by 1 percentage point in Q4, to reach 89% of US households.
SVOD contracted for the second consecutive quarter, but like in Q3, categorical declines are driven primarily by Netflix. With two new streaming services entering the AVOD space in Q4, the AVOD category grew the fastest in the quarter, up 17% quarter on quarter and 33% year on year. The FAST category, now reaching a quarter of US households, grew 3% quarter on quarter, and 35% year on year.
The acceleration of AVOD indicates streamers are looking for cost savings as they continue to grow their streaming repertoire. US households are using 5.4 streaming services on average as of Q4’22, up from 5.2 in Q3.
The rise in stacking is not slowing, even with concerns of costs. Going into Q1’23, planned cancellation of US streaming is steady at 5% of subscriptions, but what is driving planned cancellation is shifting. With inflation being felt across categories, planned cancellation of streaming is increasingly driven by costs. Nearly 1 in 3 planned cancellations are now driven by wanting to save money, with another 15% driven by price increases of streaming subscriptions.
AVOD’s impact on the expanding streaming repertoire also lends itself to boomerang behavior. In the latest quarter, AVOD subscriptions were 57% more likely to be cancelled in Q1’23 than SVOD subscriptions.
This increase in planned cancellation is more often due to reportedly having too many subscriptions. The industry’s focus on AVOD is a double-edged sword: it provides cost savings to streamers who may otherwise cancel a service, but it also creates a growing cohort of churners and switchers who tend to be less loyal when their repertoire becomes too big.
Beyond costs, content is still key to driving new sign ups. The top growing services in Q4’22 are linked to specific titles. Sports (both the NFL and Soccer), Yellowstone, and House of the Dragon were top titles driving sign up in Q4. These titles demonstrate that investment into new content and licensing are still necessary to drive growth. Expect services that cut back on investments in their content library to face additional challenges of retention and growth, and those that don’t have a leg up on competition in the coming quarter and year.
Netflix AVOD has a slow start in US, despite Wednesday success
Netflix launched its AVOD service, Netflix Basic with Ads, in November 2022. Costing $6.99 per month, it provides cost savings of $3 per month compared to its Basic without Ads, SVOD tier. This ad-based offer aims to reduce the high churn Netflix has faced over the last year, win new subscribers, and win back lost subscribers. So far, Netflix is not seeing the expected results. In the last quarter of the year, Netflix’s subscriber base continued to decline. Netflix Basic with Ads now accounts for 12% of its subscriber base, but the savings of $3 a month was not enough to win new subscribers. 11% of Netflix subscribers in Q3 traded down to Netflix AVOD in Q4; and of all new AVOD subscriptions in the quarter, only 2% went to Netflix. Trading down accounted for nearly all Netflix AVOD subscriptions in its first two months. Netflix subscribers who traded down to AVOD tend to be less satisfied with the service. The amount of original content, variety of content, and quality of the content are sticking points with Netflix AVOD subscribers compared to the ad-free subscribers, pointing to higher churn rates among this group in the future.
It typically takes a highly trending title to win new subscribers, whether they were previous subscribers or completely new to the service. At the next viral show, Netflix can likely expect more growth in its AVOD service. At the moment, Netflix is still relying on Stranger Things to draw in new subscribers. Not even Wednesday or The Crown were able to bring in enough new subscribers to offset losses, despite being the top most enjoyed titles on the platform in Q4.
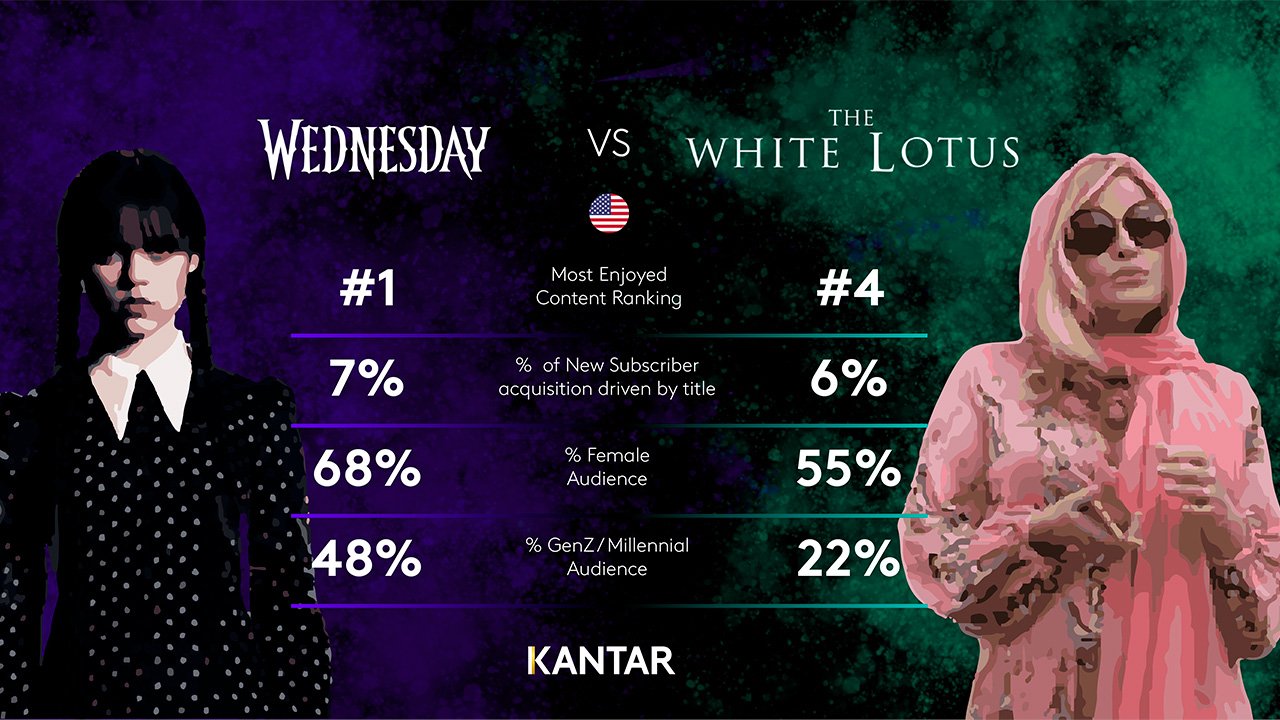
Wednesday was the top most enjoyed title in the month of December. It beat out White Lotus despite both titles getting significant social media attention. The key difference among the audience of the two trending titles is the proportion of Gen Z and Millennials who rated it as their top titles: Wednesday viewers were more than 2x as likely to be Gen Z or Millennial than White Lotus viewers, driving the social media success of the show.
Access the interactive data visualization for more information.