

The proportion of U.S. households with video streaming services has grown to 88% (up 2% points quarter-on-quarter), after seeing no growth in during the first quarter of 2022. This increase means there are now 113 million households accessing streaming services as of June 2022.
This growth underscores the resiliency of streaming and consumer demand despite challenging economic conditions for U.S. households. This can be further seen in the continued strength of stacking, which grew again quarter-on-quarter, with the average household now having five subscriptions.
The consumer analysis comes from Kantar’s Entertainment on Demand (EoD) streaming analytics and consulting service, which looks at subscriber and viewer behavior. Second quarter highlights include:
- Growth in U.S. streaming is coming from all streaming tiers. SVoD (paid streaming without ads) is up 1.5% points to 82.9%, while AVoD (paid ad-supported streaming) grew by 1.6% points to 26.9% household penetration. FAST (free, ad supported streaming) grew by 2.1% points to 22.3%.
- While all three tiers drove growth of streaming during the quarter, growth of FAST slowed quarter-over-quarter (by -2% points) as growth of AVoD accelerated (by +3% points).
- Stacking is once again growing quarter-over-quarter, with the average streaming household accessing five different services.
- As stacking grows, churn remains high at 8% of subscriptions cancelled. Value is increasingly important to retaining streamers as platforms are competing for screen time or risk being cancelled and replaced.
- Cable TV has declined, losing more than 1 million subscribing customers from between the first and second quarter of 2022. Cable TV now has a U.S. household penetration of 55%.
- Netflix subscribers continue to shrink, resulting in a decline in streaming market share. In the second quarter 61% of U.S. streaming households accessed Netflix, down 6% points year-over-year.
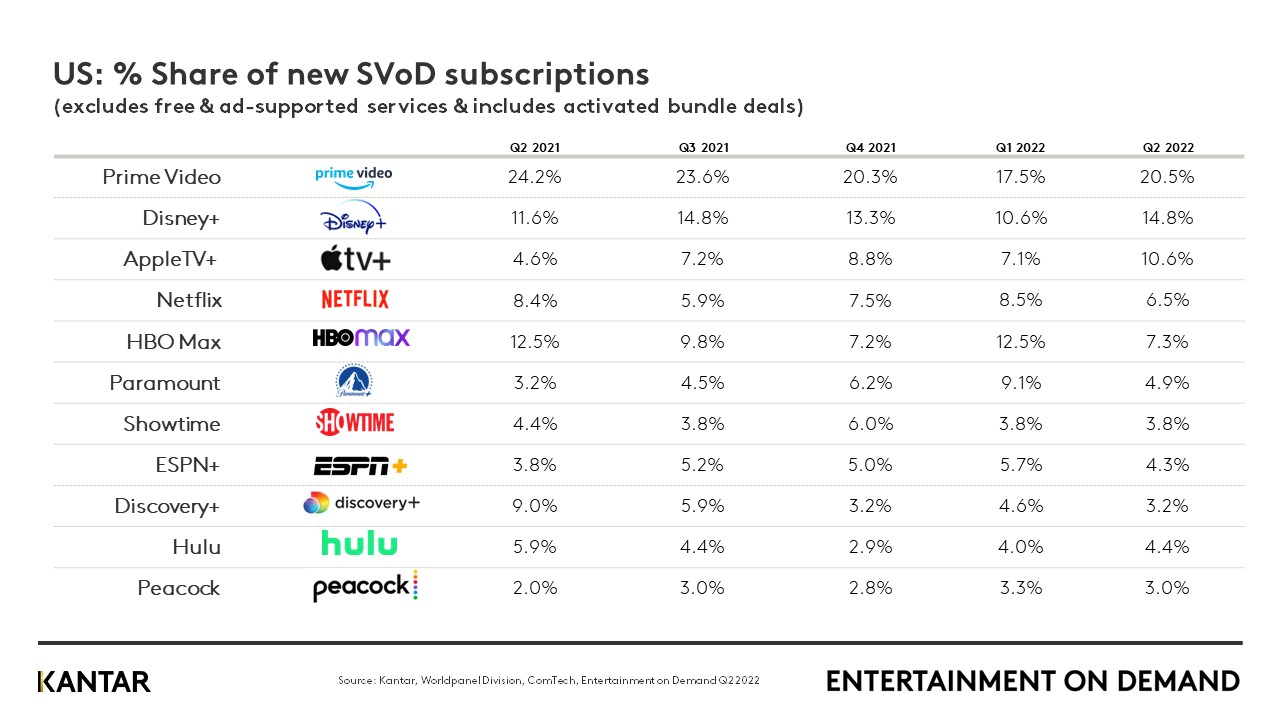
- Amazon Prime Video is the #1 destination for new SVoD subscribers for the fifth consecutive quarter, but there was increased competition from Disney+ and Apple TV+ gaining share.
US streaming market trends
In the first quarter, U.S. streaming growth stalled and for the first time, consumers were not adding subscriptions. While there is some degree of concern with inflation in the U.S., it’s not to the extent as seen in other global markets (i.e., UK). After the first quarter's flatline in the U.S., consumers are now back to adding more services, officially reaching 5 services used per household as of the second quarter, with an uptick of +0.2 quarter-on-quarter. Growth is coming from all streaming tiers: SVoD (paid ad-free streaming), AVoD (paid ad-supported streaming), and FAST (free ad-supported streaming). Despite all levels of access seeing growth, it continues to be AVoD and FAST that are growing at the fastest rates. Household penetration of SVoD services is up 2% quarter-on-quarter, AVoD is up 6% quarter-on-quarter, and FAST is up 10% quarter-on-quarter.
This upward trend of significant AVoD and FAST growth is correlated to high stacking. As stacking reached new heights, consumers were willing to reduce their overall streaming costs for ads. Streaming has gone full circle, once being the destination to avoid Cable TV ads, to increasingly relying on ads to drive growth. Despite ads becoming more common in streaming, consumers are still cutting traditional Cable. In the second quarter, Cable lost more than 1 million households as ad-based streaming grew. Streaming has proven itself to be the more inelastic service, even as the U.S. is fighting record inflation. The growth of stacking during the quarter indicates that consumers are not willing to cut out streaming to save money in times of economic uncertainty. Instead, they will look to other ways to cut costs.
Although stacking is up, churn has stayed at a relatively high level for the first half of the year, with 8% of subscriptions being cancelled in the second quarter. Similar to first quarter, this high churn coupled with high stacking indicates consumers are switching and boomeranging between platforms. This behavior is largely driven by specific trending content. As showcased in the following case studies, boomerang subscriptions can be prevented through cost-saving options like AVoD, FAST, or bundles, and by expanding content variety on a platform.
Q2 stream of consciousness case studies
Netflix
In the first quarter, Kantar identified 7% of Netflix’s subscribers who were at high risk of churn in the second quarter through predictive modeling. In actuality, 6% of Netflix’s subscriber base churned the second quarter, resulting in a continued loss of market share. In the first quarter, Kantar predicted Netflix would see a churn of 7%. Netflix reached 61% of U.S. streaming households in the second quarter, down from 67% one year ago. Yet, Netflix consistently has one of the highest Net Promoter Scores (NPS) due to its high proportion of Promoters and low proportion of Detractors. This indicates there is a long-standing group of loyalists who are less likely to churn. Among Netflix loyalists, the platform outperforms competitors on satisfaction with both content and interface related features. For example, compared to total streaming satisfaction, Netflix over-indexes on new release films (idx. 150), amount of original content (idx. 134), and ability to download content (idx. 162). In fact, Netflix’s only underperforming drivers of satisfaction are sports events, in which Netflix does not currently play, and value for money (idx. 94).
As of the second quarter, just over one third of Netflix’s subscriber base is satisfied with its value. While this is largely in line with the industry average, quarter-over-quarter Netflix subscribers have been consistently less satisfied with its value. In today’s streaming world of high stacking, value becomes more and more important to retaining subscribers in order to justify the cost of a service. With the costs of Netflix rising in the first quarter, satisfaction with value saw its single largest decline in a quarter, and planned cancellation due to price increase saw its largest hike. Netflix subsequently lost subscribers in the first quarter and is still feeling the ramifications. Value for money continued to lose share in the second quarter. Additionally, planned cancellations due to an increase in price has yet to return to pre-price increase levels.
Unsurprisingly, as Netflix has raised prices to combat password sharing, some customers have taken that to mean that access for multiple members of their household are being limited. For the last two quarters, Netflix customers have been increasingly dissatisfied with the ability of different members of their household to access the platform. Netflix expected to lose customers as they fight password sharing, and their strategies are having lingering effects on how loyal customers perceive its features and value.
Netflix’s introduction of an ad-supported tier is a suitable strategy to combat losing subscribers due to its cost and value. Netflix can expect to continue retaining its consistently large group of Promoters, but an AVoD offering can help win back its lost subscribers. Both an SVoD and AVoD offering also creates an alternative to churning from the platform for those who planned to cancel to save money. Netflix has proven it has significant strengths in the market, despite losing subscribers. It has the content and easily navigable interface to keep subscribers engaged.
HBO Max
HBO Max has seen consistent growth quarter-on-quarter, now having a market share of 20% of U.S. streaming households, up 8% points in 2022. HBO Max is unique in that its growth is coming from both its SVoD and AVoD tiers. HBO Max is driving satisfaction across both viewer types, as indicated by its NPS scores. HBO Max now has the highest NPS score of all streaming platforms, at 46 in the second quarter. This breaks down to 45 among its SVoD subscribers and 50 among its AVoD viewers.
This growth in NPS is correlated with drivers of satisfaction. HBO Max has captured two unique viewer groups to SVoD or AVoD. Its SVoD subscriber tends to be more satisfied with HBO Max’s new release films and original content. Its AVoD viewer tends to be more satisfied with its quality and variety of TV series. With AVoD driving growth of the streaming category as a whole and stacking rising, this speaks to the larger trend of AVoD viewers looking for more variety across their broader streaming repertoire and within each platform.
To further demonstrate, of all new streaming subscriptions in the second quarter, AVoD consumers were more likely driven by variety of TV series (accounting for 20% of new subs in the second quarter) versus SVoD subscriptions (accounting for 16% of new subs).
We can expect the HBO Max consumer to become more broadly satisfied with content, whether series or films, in both SVoD and AVoD tiers. Over time, HBO Max’s new SVoD sign ups have become more likely driven by variety of TV. In the second quarter, variety of TV drove 20% of new HBO Max SVoD sign ups compared to 14% of AVoD sign ups. On the flip side, new release films drove 18% of new HBO Max SVoD sign ups and 21% of new AVoD sign ups. This reversal of traditional content interests means HBO Max will have both types of subscribers engaging with all types of content on the platform. HBO Max could not have gotten to this point without first offering the variety that AVoD subscribers look for.
Hulu
Hulu is the third-largest streaming service in the U.S., with 1 in 3 streaming households subscribing to either Hulu AVoD or Hulu SVoD in the second quarter. Its household penetration has grown by 3% since the beginning of the year, primarily driven by its AVoD tier. Hulu’s growth has been slow and steady, and they have met the needs of their customers through various cost saving options. As one of the first streaming platforms with an ad-supported tier, Hulu benefited from the trend towards AVoD. Additionally, their various other cost-saving options have helped them to continue growing their market share in an ever-competitive market. For example, in the second quarter roughly 27% of Hulu subscriptions are now bundled (either with Disney+ and ESPN+ or through other offerings like Spotify). This is up 3% points since the first quarter. While Netflix is actively trying to prevent password sharing, Hulu’s AVoD viewers are increasingly satisfied with their ability for multiple streamers to create their own profile on a single account. Hulu’s AVoD viewers are stating this as a reason for satisfaction, with the platform up by 15% quarter-on-quarter. Although revenue prohibitive for the business, this is another way consumers are looking to cut costs, which is not likely going away.
Beyond driving value through cost savings, Hulu has worked to diversify its content beyond its next-day airing and licensed TV series. Hulu consumers are taking greater notice of their original content and new release films, which are heavy competition areas with both Netflix and HBO Max. Hulu still under-indexes on both of these drivers of satisfaction as of the second quarter, but has been working to close the gap. Satisfaction with original content grew 2% points quarter-on-quarter, and new release films grew 4% points quarter-on-quarter.
What’s working for HBO Max and Hulu
Both HBO Max and Hulu have seen growth. The platforms have focused on cost-savings to prove value and created a content niche that over time they expanded: HBO Max with new releases and Hulu with next-day cable to Hulu TV series. Both started by offering something unique to the market, and with greater competition have focused on diversifying their offerings to drive engagement.
Looking ahead
Expect to see continued high rates of churn as consumers, particularly those opting for AVoD subscriptions, seek variety in the content they consume. Note that overall streaming penetration grew in the second quarter, despite churn being high in the same quarter. This reflects the new normal of platform hopping. Platforms that prove their value via lower costs and a wide selection of content are better positioned for retaining subscribers. Yet, expect more consistent switching behavior and high rates of churn ongoing.
The U.S. streaming market is not showing signs of slowing down. Platforms today should focus their strategies around this new normal of boomerang behavior. This means retaining the loyal core of streamers, marketing trending titles to win streamers leaving other platforms, and communicating the content variety available on the platform to retain the boomerang subscribers.
Access the interactive data visualization tool to explore current and historical SVoD market data for your region.