Global out-of-home (OOH) spend on snacks and non-alcoholic drinks is now very close to Q1 2020 levels, with a year-on-year increase of 27% in the last quarter, thanks to a particularly strong performance in Europe and Brazil. This has contributed to a combined value increase of 8% across OOH and in-home snacking and drinking.
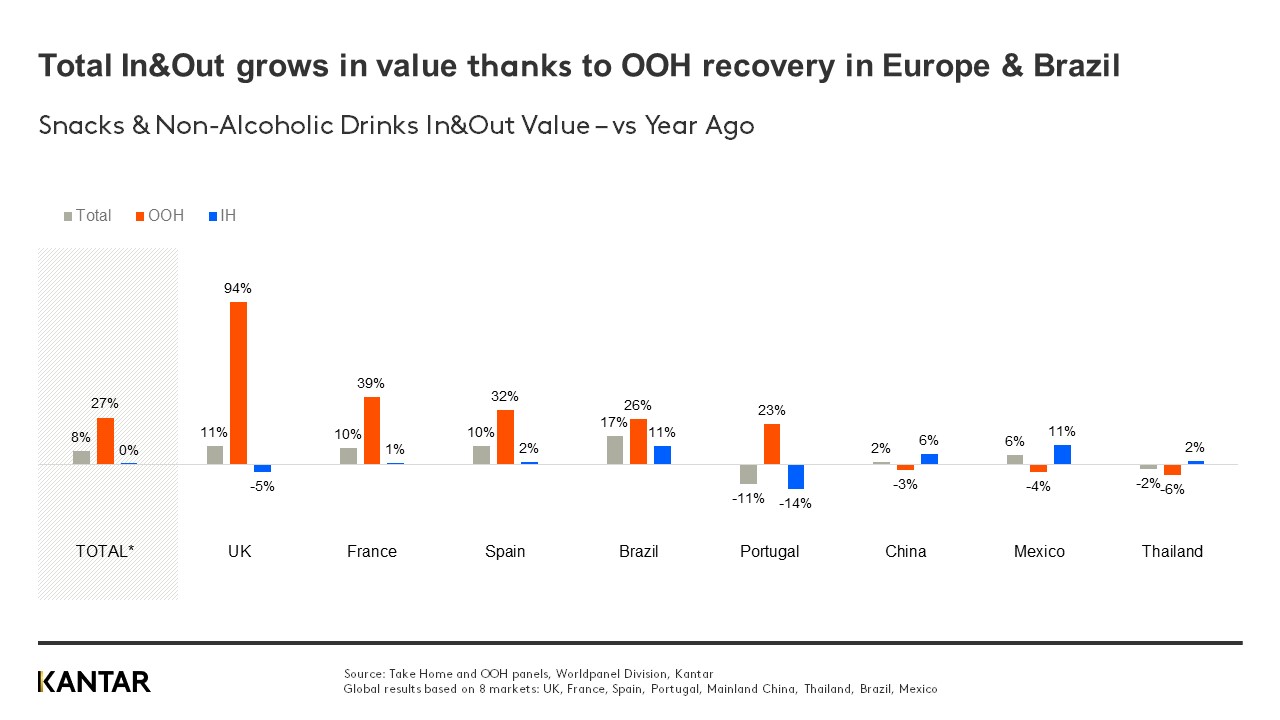
This is the fourth consecutive quarter we’ve seen a positive growth trend. However, while recovery has been faster than expected, the value coming from OOH still has a way to go before it’s restored to pre-pandemic levels. This is a general trend, seen across all markets – and progress in China, which appeared to be leading the way in Q4 of 2021, has been impeded by the recent outbreak of COVID-19 and resulting strict lockdown measures.
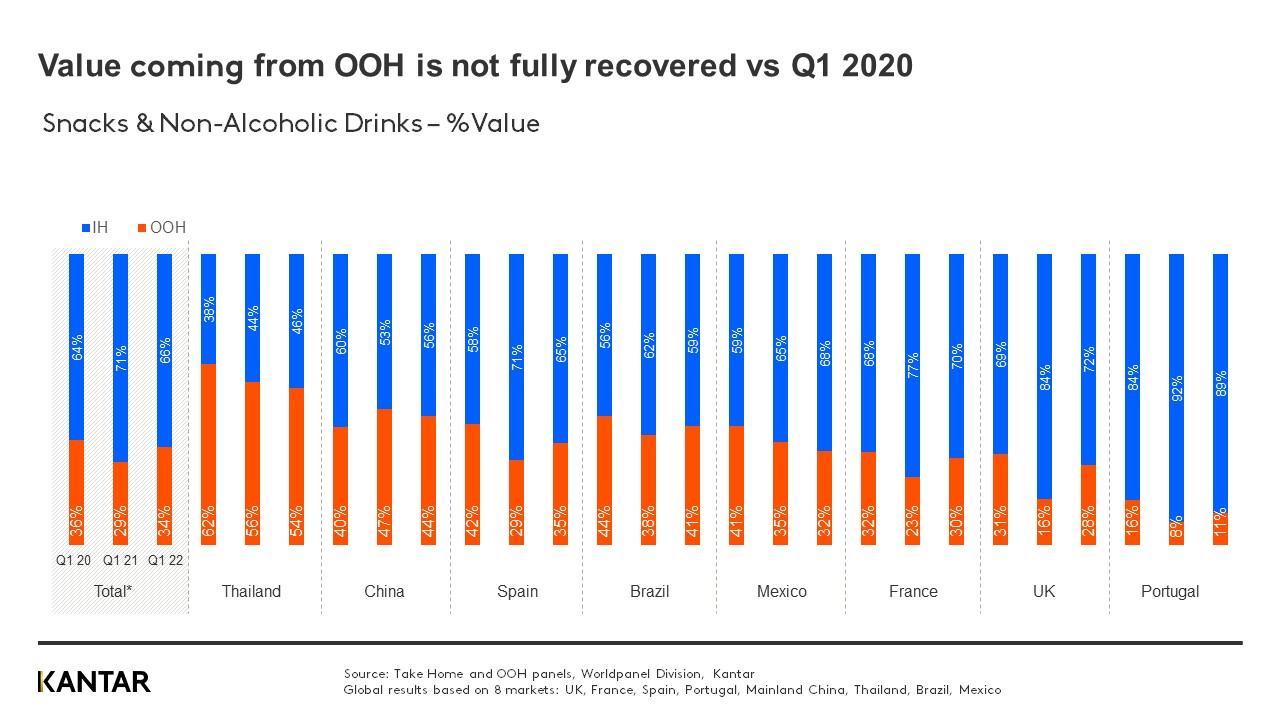
Much of the growth in OOH and in-home has been complementary: shoppers are sticking to the habits they formed during the pandemic, incorporating OOH occasions back into their routines without losing the new in-home snacking and drinking moments. It will be interesting to see the other ways in which COVID-19 has made a difference to consumption habits.
Value is driven by people going out more, and buying more
Despite the ‘hype’ about recent price increases impacting consumption, and being the main driver of increased spending, this is not the story for OOH. If we look at the UK, where value has grown fastest with a year-on-year rise of 94%, we see that almost half came from an increase in occasions or trips, and a fifth from people buying more units per trip. Price rises are not discouraging people from visiting OOH outlets to consume drinks and snacks.
This is not the case for take-home purchases, where inflation is affecting people’s choices, resulting in a drop in value in Q1 of 2022 in the UK. Consumers are downtrading; visiting cheaper channels or stores or choosing cheaper brands to manage their shrinking budgets.
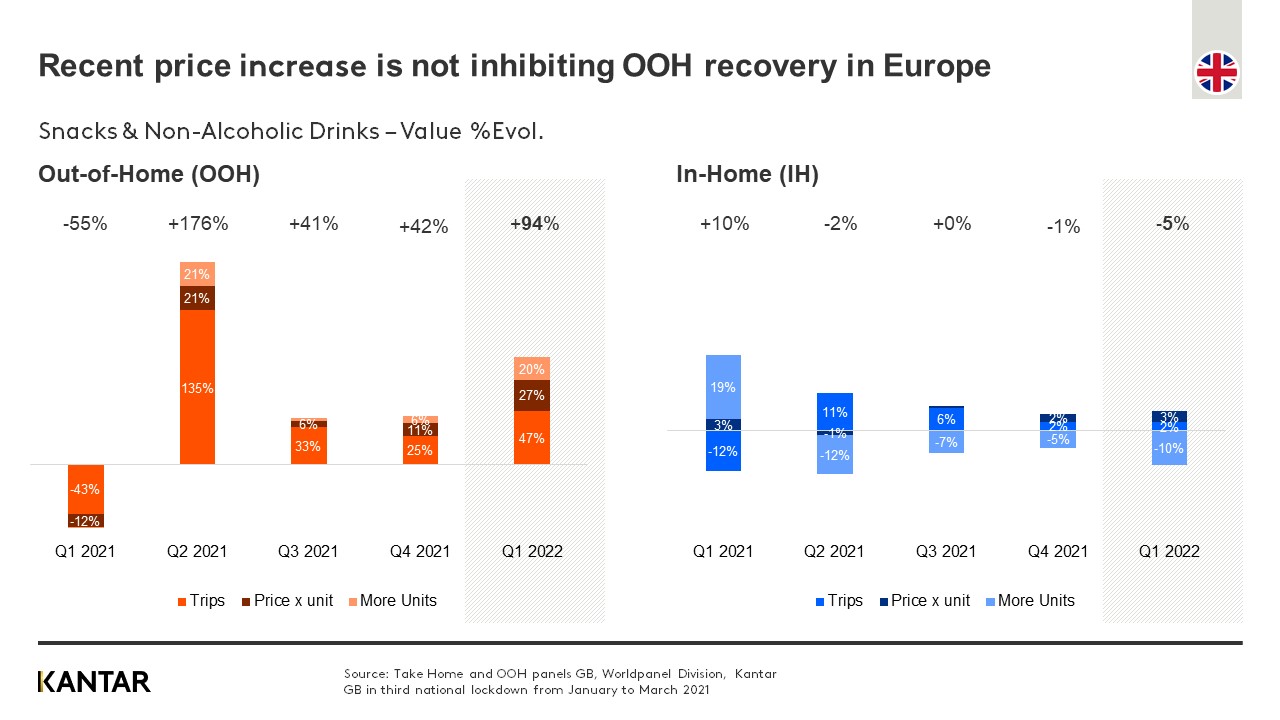
While 27% of the total value growth in the UK is due to price increases, this is largely due to consumers returning to Horeca – restaurants, bars, cafés and coffee shops – which sell drinks and snacks at a higher price than supermarkets, for example.
Overall, the recovery of OOH spend to pre-pandemic levels will be highly dependent on Horeca, especially in Europe where these channels are key. Value sales of snacks and drinks through Horeca have grown 62% over the last year.
A changed channel landscape
As a consequence of the shift from OOH to in-home spending during the pandemic, the channel structure for in-home consumption has remained the same, while OOH seems to be experiencing at least a temporary transformation.
Quick service restaurants (QSR) and impulse channels are almost back to normal already – in another example of how consumers are sustaining the behaviours they established during lockdowns. Street vendors and traditional trade channels, which consumers were still able to visit while other outlets were closed, have also recovered faster than hypermarkets, supermarkets and convenience stores.
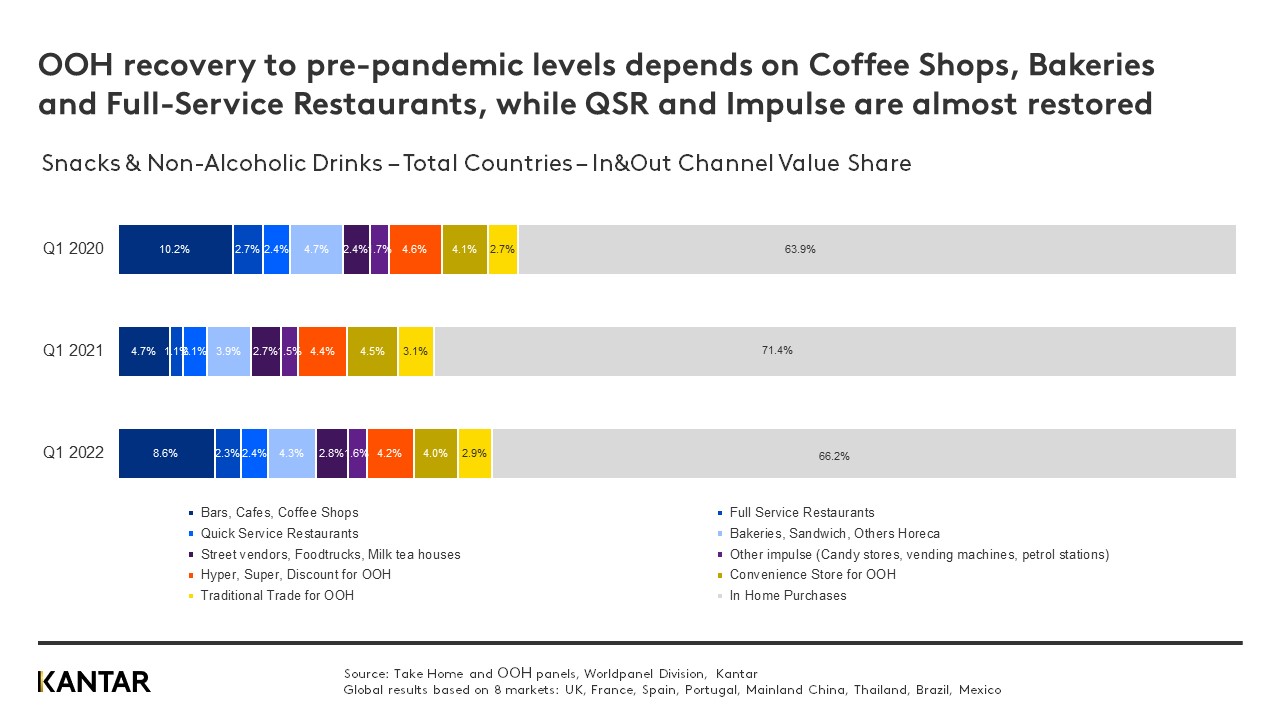
Soft drinks, coffee and ice cream are the fastest growing categories in OOH. Ice cream is the only snacking category where the value balance between OOH and in-home has been fully restored – in fact, the OOH share of spend is greater than it was pre-pandemic.
Salty snacks is the no.1 choice in OOH
The OOH market is essential to value performance within the salty snacks category (crisps, chips, nuts and snacking fruit): a huge 70% of spend comes from OOH sales in Thailand, for example, and 60% in Mexico.
Overall, snacks categories have been more resilient than drinks – seeing less of a decrease in OOH value alongside growth in in-home, where they were successful in enabling households to reproduce outside occasions. However, OOH spend on salty snacks has still not returned to pre-pandemic levels, with a share of 26% of combined OOH and in-home spend, compared with 28% in Q1 of 2020.
Looking at a brand level, Lay’s has been the standout performer, and is the top snacking brand choice for OOH consumption. Our recent Brand Footprint OOH ranking shows that Lay’s finished 2021 with more consumer reach points (CRPs) than it had in 2019; truly impressive, given that salty snacks has recovered more slowly than other OOH categories. What’s more, Lay’s biggest OOH markets are Mainland China and Thailand, where salty snacks sales are still declining or stagnant. Defying the odds, the brand has managed to drive growth in both markets.
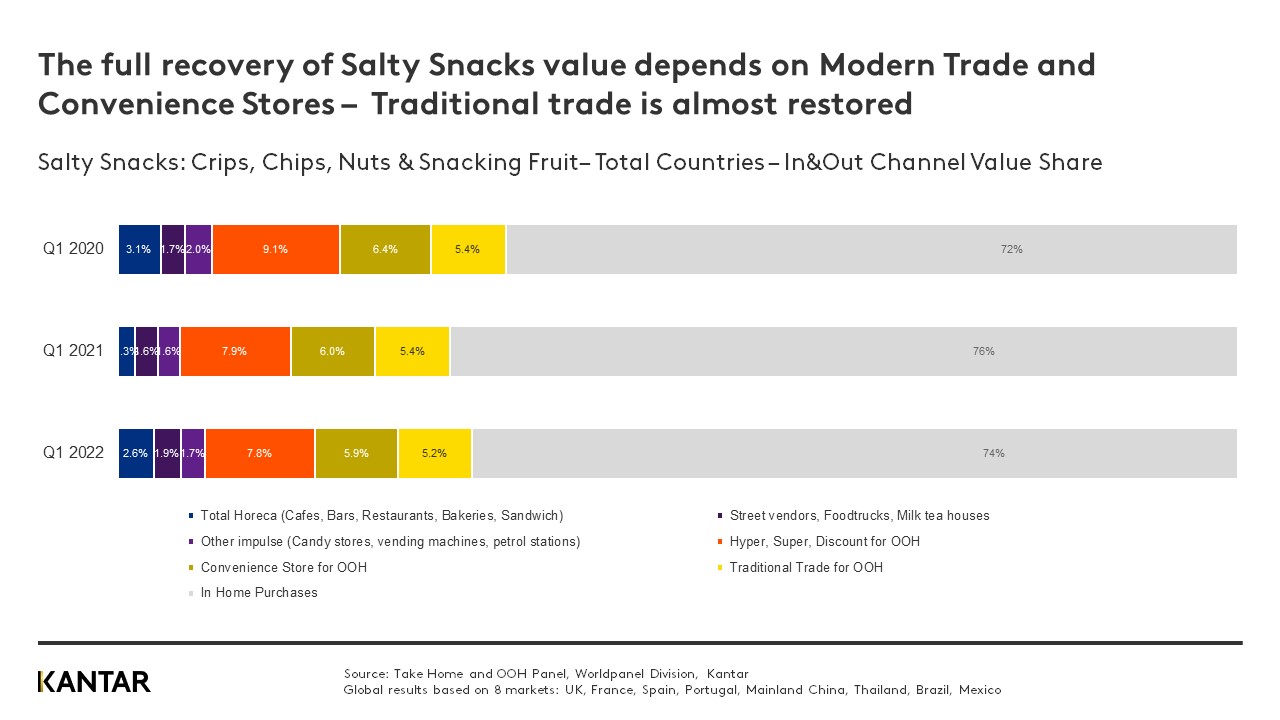
A specific segment, flavour and format strategy by channel is required to fuel OOH recovery in salty snacks. As seen in Mexico, where the category is the top snacking choice in OOH occasions, the full recovery of value will depend on modern trade and convenience stores; while spend in traditional trade and street vendors is now bigger than it was pre-pandemic.
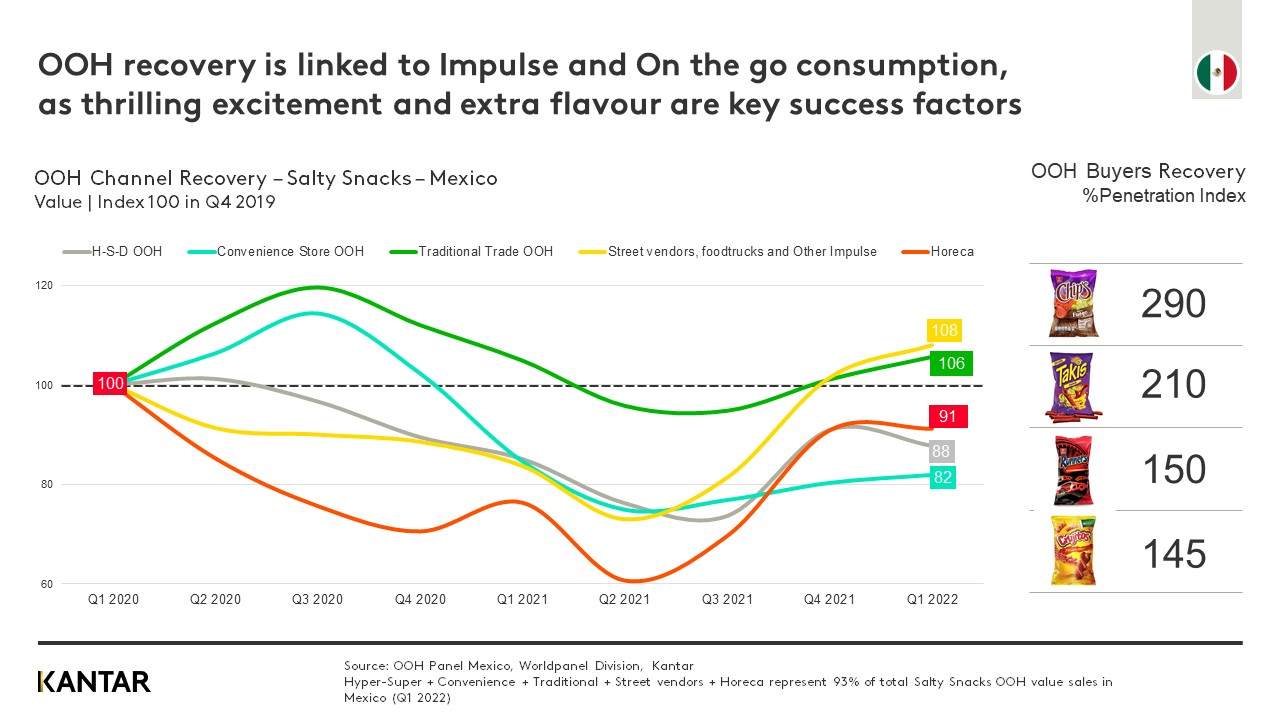
Recovery will also be strongly linked to impulse and on-the-go consumption, as consumers persist with the habits they built during the pandemic, so brands must ensure availability via these channels. Creating excitement through spicy and interesting flavours is also a key strategy to win buyers back to OOH.
Find out more about the OOH global snacks and non-alcoholic drinks market by downloading the full Q1 2022 Out-of-Home Barometer through the form below, or reaching out to our experts.
