
In today’s fragmented and personalised media landscape, the answer to providing a meaningful understanding of audiences cannot be answered by a simple solution. Connecting the right information on the usage of content into a holistic view must be the driver behind the evolution of currencies as viewing behaviour on TV and video streaming platforms continues to change.
Viewing, and the investment in content and ad revenues that come with it, is dispersed across a larger number of platforms and screens. Kantar’s Cross Media Audience Measurement helps broadcasters and media owners answer 3 fundamental questions:
- Where is the audience of my channels and services?
- Why and how is viewing shifting to streaming and Subscription Video On Demand (SVOD) players?
- How can I engage with the multi-screen audience?
Finding the viewers
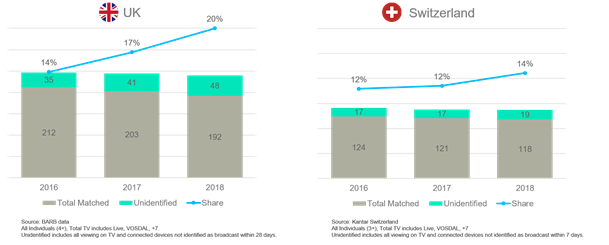
Kantar’s recent data from our Cross Media Audience Measurement services in Switzerland and the United Kingdom shows how total time spent on the big screen is quite stable, while unidentified share of viewing is growing. Media owners must understand what other things people are doing on the TV set and how their content is performing on other platforms to include in their performance monitoring.
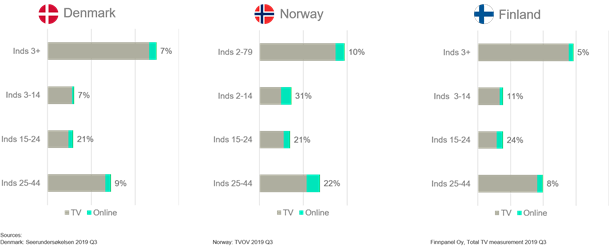
Our Extended TV services – Kantar’s gold-standard for audience measurement capturing TV and broadcaster online video within and outside the broadcast reporting window - provide insights on where and who these audiences are. Our audience data from Nordic markets such as Denmark, Norway and Finland show that between 5% and 10% of the time spent on broadcaster content is on streaming services. For audiences aged 15 to 24, more than 20% of their viewing time of broadcaster content is online.
These online ratings are an important revenue source when added to the linear and time-shifted viewing TV ratings and provide valuable insights on how to increase content performance.
The "why" behind the streaming
Understanding how programs are performing across platforms help us answer the question of why some content is watched on TV sets versus streaming services on other devices.
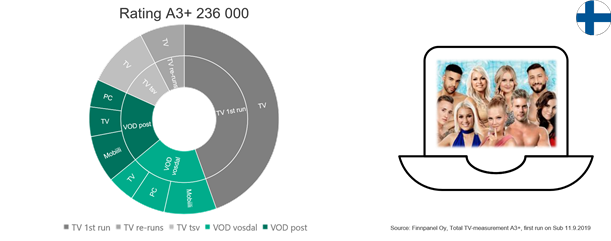
By looking at our Cross Media Audience Measurement data in Finland, we see how 63% of the viewing for a particular episode of Love Island came from broadcast TV, either live or via catch up, while 37% was watched on the broadcaster’s online streaming services. We also see how 72% of the audience watched this episode on the big tv screen, 17% on mobile devices and 11% on a personal computer.
Broadcasters face major competition from global online streaming players and need to understand what's happening across content providers to define their content and monetization strategy.
Kantar’s router metering technology, the Focal Meter 2, is embedded into our Cross Media Audience Measurement services to provide insights into what was previously hidden behind unidentified viewing.
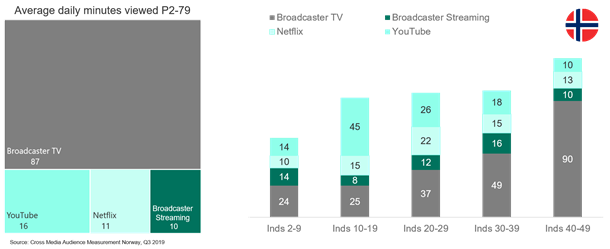
In the United Kingdom, where the Focal meter 2 is currently being deployed following a successful trial, we found that one third of the unidentified viewing comes from SVOD enabled services like Netflix and YouTube. In Norway, we report overall in-home viewing figures for Netflix, which we have found to take over 10% of the media day, and YouTube, by far the largest source of content for teenagers. While the viewing data is not part of the official currency in Norway, it gives media owners valuable insights in how well they perform against these competitors in various target groups across all devices.
Connecting audiences across screens
In order to define their strategies, broadcasters and media owners need to understand the complex multi-screen viewing behaviour of their audiences.
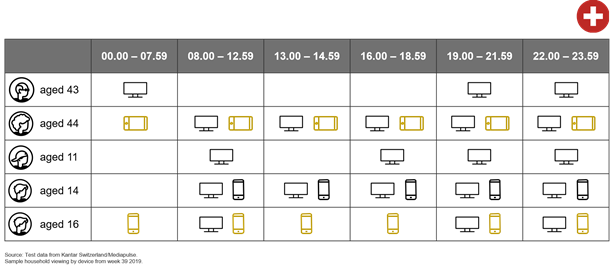
Data from a qualitative test in one of our panel households in Switzerland show how, while the tv set is used by all members of the home, the mother is very attached to her iPad and the 16-year-old always keeps his smartphone with him. It is crucial for our clients that our Cross Media Audience Measurement captures this complex behaviour.
Our viewing data demonstrates how audiences also tend to prefer different screen sizes depending on who they are and what they're watching. While the TV set is a dominant screen for 25-year-old viewers and above in Finland, people below 25 are watching almost half of their broadcaster streaming content on their smartphones. In the United Kingdom, half of the time spent on Netflix is watched on the biggest available screen – the TV set - while YouTube is heavily watched on mobile devices and Amazon Prime has its highest consumption on PCs and laptops.
More choice, more engagement
To survive in the 21st century, broadcasters and media owners must understand what's happening across screens, not only for their own content but also content from other platforms like SVOD services, to enable them to build competitive content and delivery strategies.
Kantar’s Cross Media Audience Measurement builds the foundation for understanding the complex behavioural questions that audiences are posing to the industry. This year we are introducing the People Meter 7, the Focal Meter 2 is the already de facto standard for online video measurement, and we continue to expand our panels with first-and-third-party data to improve quality and granularity of our service.
Our blueprint enables broadcasters to have a full picture of their audiences and improve the Return On Investment of currency data by taking it forward for activation. We are working with multiple clients on using gold currency data to support digital trading and starting to fuel the future of addressable ads, including on TV.