

Out-of-home (OOH) consumption of snacks and non-alcoholic drinks has continued to recover through Q2 of 2022, according to Kantar’s latest OOH Barometer report – the fifth consecutive quarter that value has risen. This has helped to drive up the combined value of in-home and OOH snacks and drinks by 7% year-on-year. However, when we look back three years – before COVID-19 hit – we see that the recent increase in spend has not been able to compensate for the loss of OOH value sustained during the pandemic.
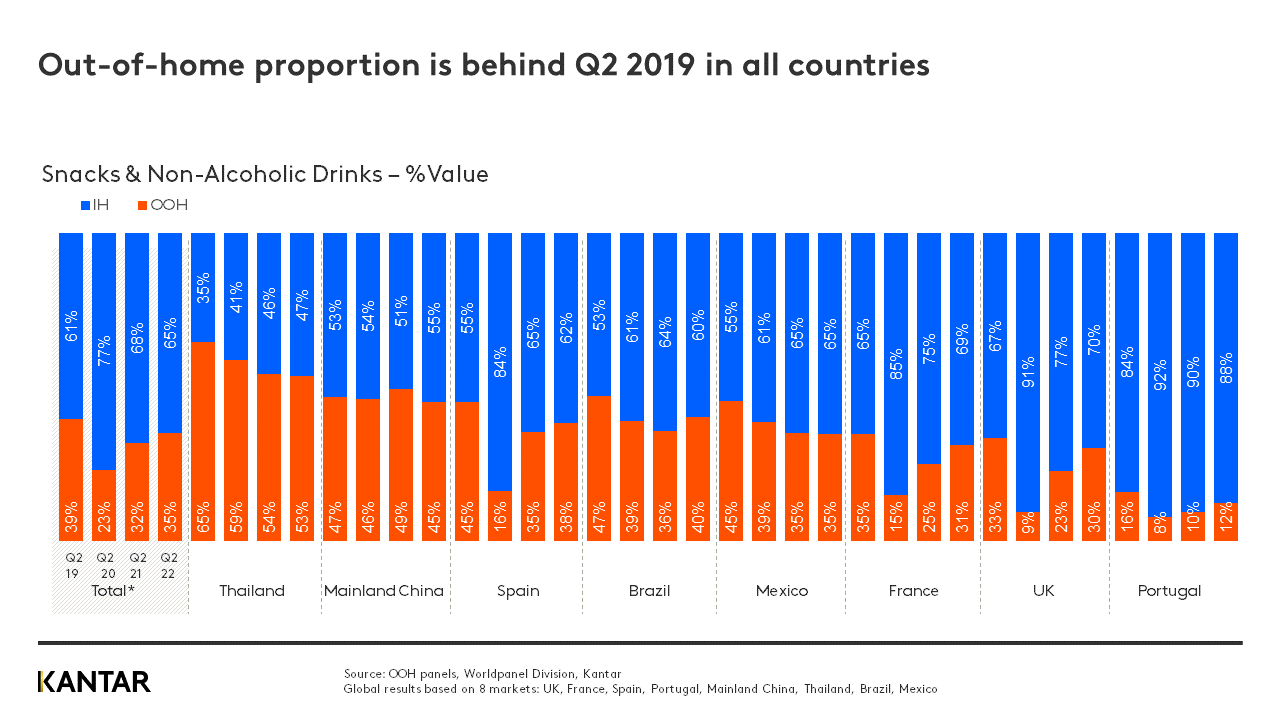
In Q2 of 2019, consumer spend on OOH snacks and drinks across the eight markets covered by the report stood at 17.6 billion. While this has bounced back to 16.2 billion, it remains below pre-pandemic levels. OOH’s share of total category spend in the full year of 2019 was 40%, which was followed by a drop to 31% in 2020. By Q2 of 2022 this figure has only recovered to 35%. The year-on-year growth curve has also flattened; from a peak of 51% in Q2 of 2021 to 18% in the last quarter.
The most significant year-on-year growth in OOH consumption has been in the UK, where consumers are comfortable with getting out and about again – up 48% compared with 2021 – while the starkest decline was seen in China (-13%), following the country’s recent lockdowns. Two quarters previously, we reported that OOH in China was recovering fastest; this highlights how volatile growth can be, and that the market value of OOH in any country is vulnerable to a change in circumstances.
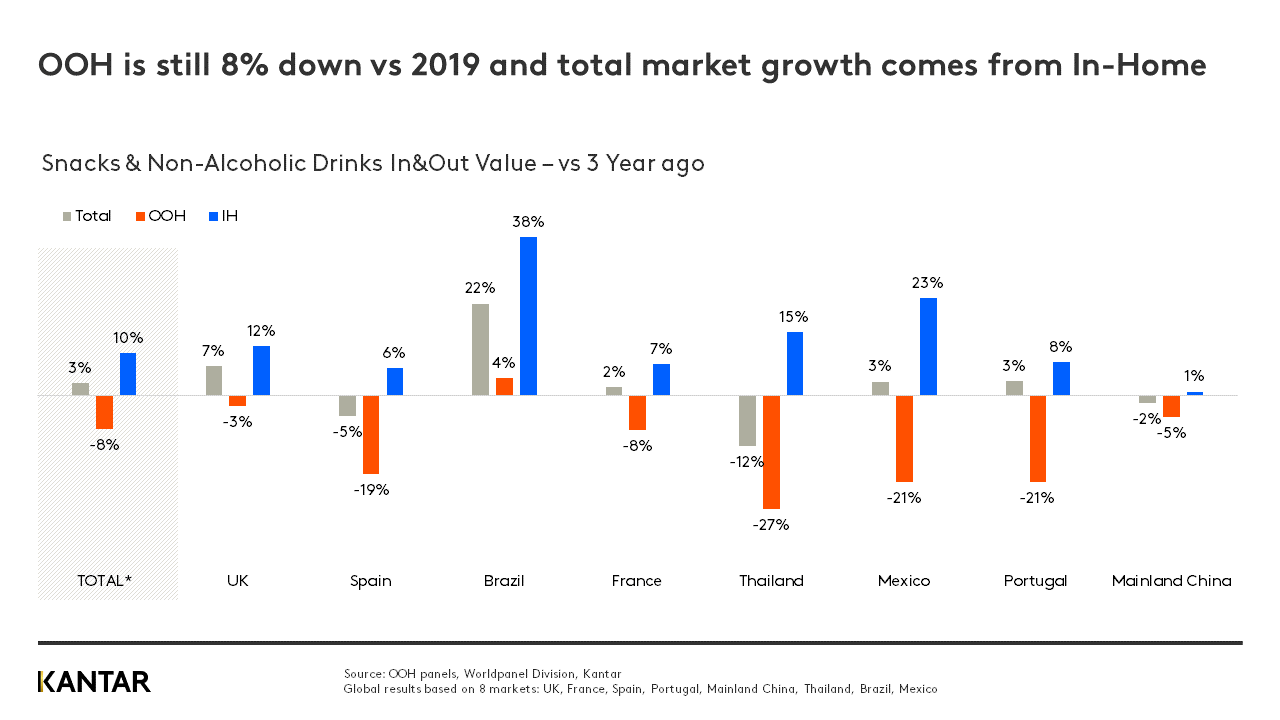
If we seek the three-year perspective, we see that OOH spend on snacks and drinks is still 8% down compared with Q2 of 2019, with drops in most markets. This means that the total market growth of 3% is coming from in-home consumption.
Channel structure is almost restored – but with gaps in Europe, Asia and Mexico
While the OOH channel landscape naturally changed during the pandemic, the global picture now looks very similar to how it did before restrictions were brought in: 55% of spend on snacks and drinks comes through Horeca (hotels, restaurants and cafes), for example, and 13% through impulse channels, exactly the same as in 2019. But of course, there are nuances in patterns between countries.
OOH is highly dependent on Horeca in Europe, and we can see that bars, coffee shops and bakeries are still some way off recovering, particularly in Spain, and also the UK. The same is true for modern trade (hyper, super and convenience stores) in Mainland China, Mexico and Thailand, where consumption of snacks and drinks in Horeca is very low, and impulse purchases are more important. The latest COVID-19 outbreak has slowed down OOH recovery in China, with street vendors, cafes and traditional channels performing best.
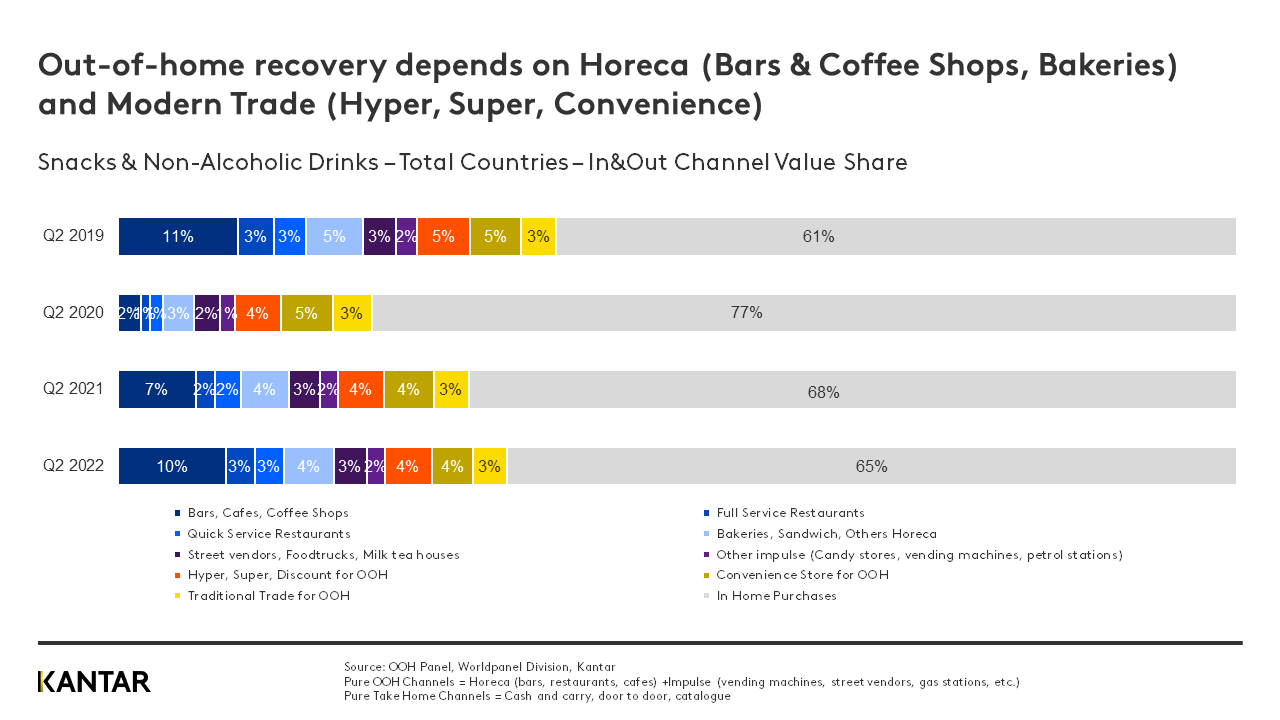
A major reason for the ‘recovery gap’ is a shift in occasions. People are mindful of the need to prioritise where they spend, to manage the increase in cost of living. They still want to consume OOH, but rather than popping into cafes and bakeries a few times a week and buying a coffee or a sandwich, they are prioritising full meals in restaurants. There’s a change here, too, with people trading down to quick service restaurants (QSR), again as a coping strategy. In fact, in the UK QSR is one of only two channels to have recovered, along with modern trade.
Recovery journey is steepest for soft drinks
Value growth is slowest in non-alcoholic drinks, with spend still lagging 10% behind the level seen in Q2 of 2019, in contrast with a 12% boost in in-home consumption. Soft drinks is highly dependent on OOH, and this was the category that was most affected by lockdown, with a particularly high volume of sales made through Horeca channels.
The proportion of total OOH value contributed by soft drinks and water is still far from being restored to 2019 levels. Hot drinks are faring much better, as they are connected with breakfast, snacking and impulse occasions, whereas cold drinks tend to be consumed with or around main meals.
At a category level, the share of consumer spend on soft drinks and water coming from OOH sales is at 49%, significantly lower than the channel’s 57% share in Q2 2019. Most markets need a ‘push’ – and this will need to come from Horeca, where the biggest gap still exists.
However, if we focus on the last quarter we can see evidence that a surge in recovery is underway: soft drinks is the fastest growing category in OOH, with a massive 35% increase in value, compared with 15% growth for salty snacks. Six out of the top 10 most consumed brands in OOH are soft drinks, according to Kantar’s Brand Footprint research – Coca-Cola, Pepsi, Fanta, Sprite, Lipton and 7-Up – with five of them growing compared to a year ago.
Every quarter, Worldpanel tracks the evolution of the OOH snacks and drinks market, examining the balance between out of-home and in-home, the channel landscape, and how different categories are performing. You can download the latest OOH Barometer deck through the form below. Contact our experts to find out the country and category-level data that is most suitable for your business.
More like this
Read: OOH recovery drives 8% boost in spend on snacks and drinks