
An overview of the ordinal scale
In market research, not all information is collected in the same way. Some data can be measured with precise numbers, like income or age. Other data is more categorical, such as gender or location. And then there are situations where what matters most is the order of responses rather than the exact distance between them. This is where the ordinal scale comes in.
An ordinal scale ranks data in a specific order, but the differences between ranks are not necessarily equal or measurable. Consider a 5-point agreement response scale that includes “Strongly disagree,” “Disagree,” “Neutral,” “Agree,” and “Strongly Agree.” These responses can be ranked from lowest to highest level of agreement, but you can’t say that the “distance” between “Neutral” and “Agree” is the same as the distance between “Agree” and “Strongly Agree.”
Ordinal scales are especially useful in market research, where businesses are less concerned with exact values and more focused on understanding relative attitudes, preferences, and perceptions. They help identify trends and patterns in consumer sentiment, even when precise measurement isn’t possible.
In this article, we’ll explore the characteristics of ordinal scales, real-world examples, and provide a few best practices for using them in market research. We’ll also look at how the Profiles team at Kantar helps organisations design surveys with robust ordinal scales that deliver insights you can act on.
Understanding the ordinal scale
Different types of measurement provide varying amounts of information and can be classified based on the amount of information they contain or how precisely data is recorded.
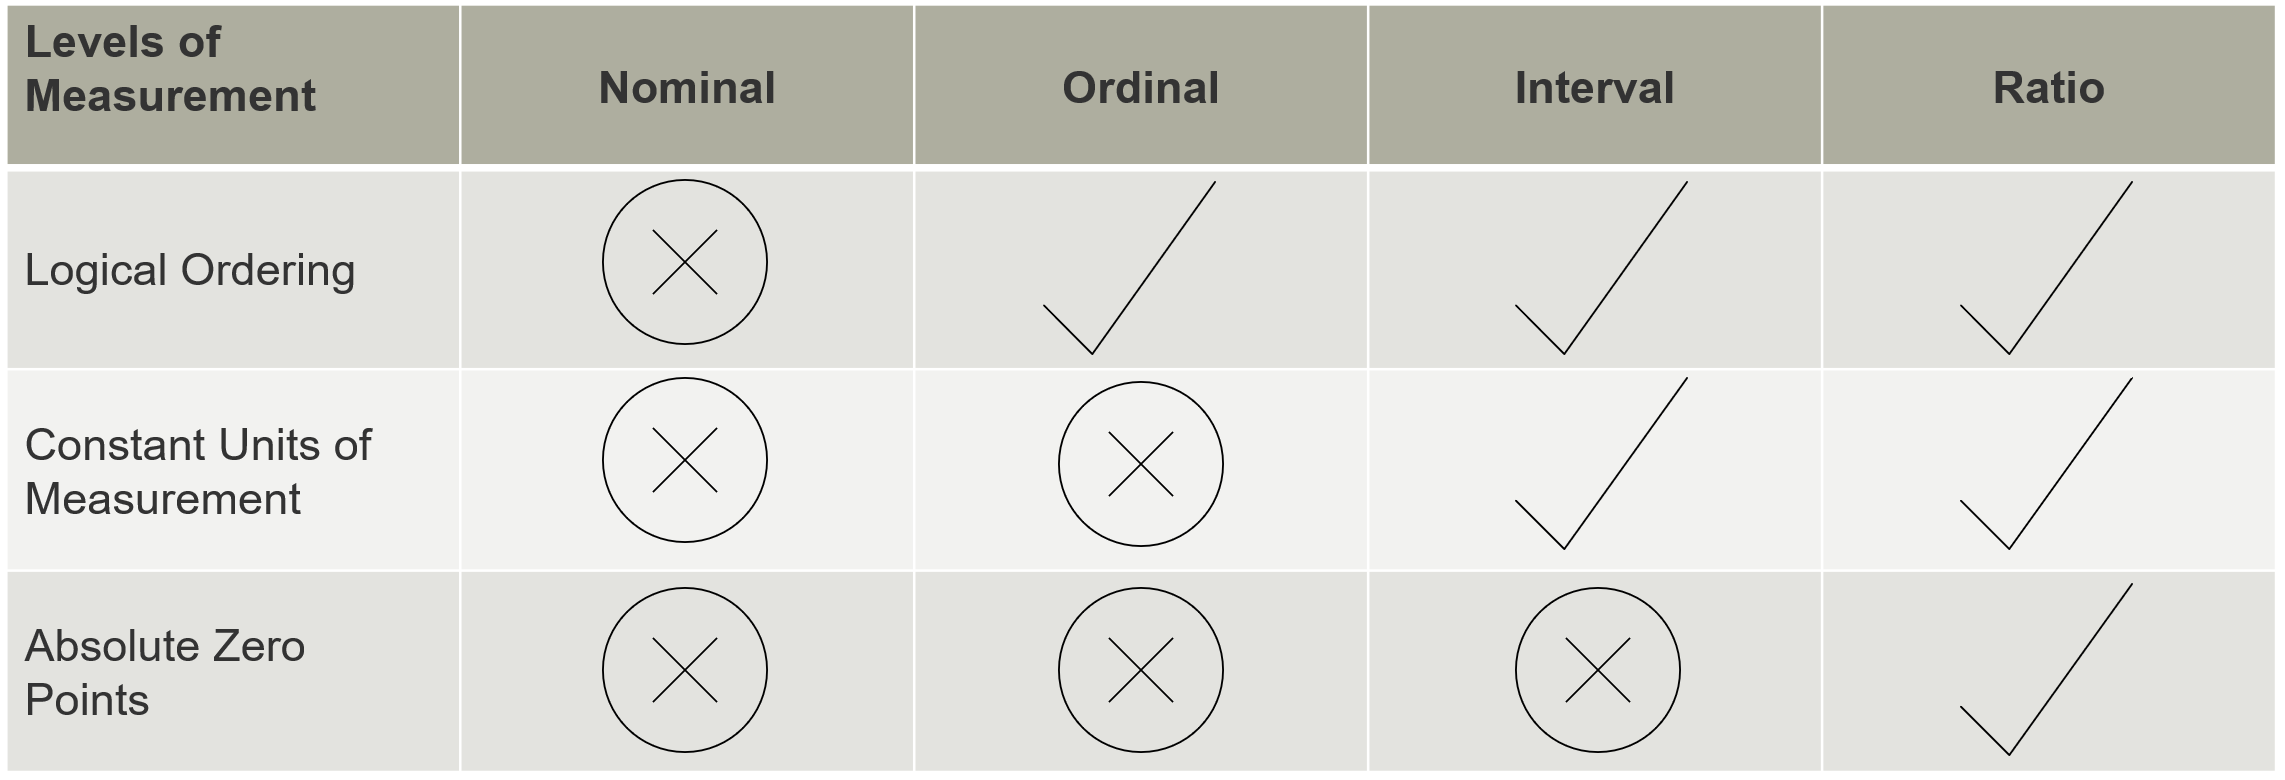
This classification is commonly referred to as the “four levels of measurement” in research:
- Nominal: Categories without order (e.g., eye color, country of residence).
- Ordinal: Ordered categories without equal intervals (e.g., satisfaction ratings).
- Interval: Ordered data with equal intervals but no true zero (e.g., temperature in Celsius or Fahrenheit).
- Ratio: Ordered data with equal intervals and a true zero (e.g., age, income).
To understand the ordinal scale, it helps to think about situations where order matters more than the precise numbers behind it.
Key characteristics of ordinal scales:
- Values represent a ranked order.
- Distances between ranks are not necessarily equal.
- The most appropriate measures of central tendency are median or mode, rather than the mean (which can only be found in some cases).
Ordinal scales obtain slightly more information than nominal level data because the data are ordered, but the space between points on the scale is not equal.
This makes ordinal scales particularly useful for measuring subjective concepts like satisfaction, preference, or frequency—areas where relative order matters more than exact quantities.
Real-world examples of ordinal scales
Ordinal scales are used every day in research, business, and even casual decision-making. Here are a few common examples:
Satisfaction ratings
Survey responses like “Very dissatisfied” to “Very satisfied” are perhaps the most common ordinal example. Each option is ordered, but we don’t know if the gap between “Dissatisfied” and “Neutral” is the same as the gap between “Neutral” and “Satisfied.”
Frequency measures
Questions like “How often do you use this product?” with options such as “Never,” “Rarely,” “Sometimes,” and “Always” are also considered ordinal. The progression is clear, but the spacing isn’t uniform. For example, “Sometimes” could mean once a week to one person and once a month to another.
Social class categories or income levels
When respondents select “lower,” “middle,” or “upper” class, these are ranked categories, but the distances between them aren’t precisely defined. Similarly, income brackets like “$25k–$50k” and “$50k–$100k” can be ordered but don’t represent equal intervals. However, if income is measured as an exact amount, it becomes ratio data.
Brand preference rankings
Asking people to rank their favourite brands (first choice, second choice, and so on) produces ordinal data. The order is meaningful, but the degree of difference between each preference is unknown.
Level of agreement
Agreement questions are another very common use of ordinal scales. Response options like “Strongly disagree,”, “Disagree,” etc. clearly follow a ranked order. However, the distance between each option isn’t precisely measurable.
Why ordinal scales are used in research
Ordinal scales are widely used in research due to their ability to effectively rank and categorise responses while being relatively easy for participants to understand.
Here are some reasons why ordinal scales are significant in research:
- Ideal for measuring attitudes and perceptions. Many concepts like trust, loyalty, or satisfaction can’t be measured with exact numbers, but they can be ranked. For example, you can’t ask a respondent, “How many units of trust do you feel toward this brand?” and get a meaningful response. These perceptions are subjective and shaped by personal experiences.
- Easy for respondents to answer. Ordinal scales provide a straightforward way to capture data, allowing respondents to indicate their preferences or attitudes through easy-to-understand rankings, such as "Strongly agree" or "Disagree." Respondents might also be more comfortable selecting from an ordered set of categories rather than providing exact measurements.
- Easy comparison between variables. The data obtained from ordinal scales makes it easier to group and compare variables. Because the responses are ranked, you can quickly see which group feels more positive, more frequent, more loyal, and so on.
- Useful when exact values aren’t necessary. For many business decisions, knowing whether satisfaction is trending upward or downward is more valuable than knowing the exact degree of difference. By applying ordinal scales in various surveys, businesses can effectively gauge consumer sentiment and make informed decisions based on general preferences and attitudes.
Because they bridge the gap between categorical and numeric data, ordinal scales provide researchers with flexible tools for understanding human behaviour.
Now that we’ve reviewed what ordinal scales are and provided some examples, let’s review some of the limitations to keep in mind.
What you can and can’t do with ordinal data
Data obtained through ordinal scales is powerful because it lets you capture respondent’s opinions, preferences, and attitudes in a structured format. However, even with responses numbered on a scale, you can’t treat them like exact measurements.
Using the same example from earlier in a 5-point agreement scale, if you consider the coding of the data, you might assign 1 for “Strongly disagree,”, 2 for “Disagree,” 3 for “Neutral,” 4 for “Agree,” and 5 for “Strongly Agree,” given these values have a natural order.
However, it's important to remember that not every mathematical operation works with ordinal data. You can compare values to see whether they are equal or not, or determine which is greater or smaller, but adding or subtracting the values doesn’t produce meaningful results.
Appropriate statistical treatments
- Median and mode: Since ordinal data has order, you can identify the middle value (median) or most common value (mode).
- Range: You can determine the span between the lowest and highest ranked categories.
- Non-parametric tests: Tests like the Mann-Whitney U test or Kruskal-Wallis test are designed for ordinal data because they don’t assume equal intervals.
Ordinal data limitations
Since means rely on arithmetic operations like adding and dividing values, and because the spacing between ordinal categories isn’t consistent or precisely known, those calculations can’t be performed.
Means and standard deviations are misleading. Because the intervals between categories are not equal, calculating averages can create false impressions unless the data is treated as interval.
Magnitude of differences is unknown. You can rank responses, but you can’t determine how much more satisfied someone is compared to another.
Researchers need to be cautious: treating ordinal data like interval or ratio data can lead to incorrect conclusions if not justified.
Visualising ordinal data effectively
Clear visualisation helps make ordinal data easier to interpret and communicate because it allows viewers to quickly see the relative order of responses without needing to focus on exact numeric differences.
Recommended chart types include:
- Bar charts: Simple and effective when ordered by rank.
- Stacked bar charts: Useful for comparing ordinal responses across different segments, such as age or gender groups.
- Bump charts: Effective for showing how rankings (like brand preference) change over time.
Design considerations matter too. Using colour, spacing, and consistent labeling reinforces the rank order, making it easier for stakeholders to grasp insights at a glance and compare groups or segments effectively.
Well-designed visuals also reduce the risk of misinterpreting the data, ensuring that the emphasis remains on order and relationships rather than assuming precise measurements. For example, you can use consistent colors to reflect relationships (e.g., red for negative, green for positive) and ensure labels can help clearly communicate the ranking system.
Applying ordinal scales in market research
Ordinal scales play a pivotal role in market research by enabling insights professionals, marketers, and brands to measure and interpret customer satisfaction, brand perception, and evolving market trends. These scales rank responses in a meaningful order without assuming equal intervals between points. This makes them ideal for segmenting audiences based on sentiment and identifying shifts in consumer attitudes over time.
Common applications include:
- Customer satisfaction: Tracking changes over time with ordered categories.
- Brand perception: Measuring how consumers rank one brand against another.
- Market segmentation: Identifying differences in preferences or attitudes across demographic groups.
To harness the full potential of ordinal scales, survey design must be intentional and precise. Here are key tips for crafting questions that yield reliable insights:
- Clarity and neutrality: Use straightforward language and avoid leading or emotionally charged phrasing. Questions like “How satisfied are you with our service?” are preferable to “Don’t you love our service?”
- Choosing the right number of scale points: A 5-point scale is common, but 7-point or even 10-point scales may offer more nuance. However, more points can also introduce complexity and respondent fatigue—so balance is key.
- Consistent labeling: Ensure each point on the scale is clearly labeled (e.g., “Strongly Disagree” to “Strongly Agree”) to avoid confusion and improve data quality.
- Cultural and linguistic clarity: For global research, translate scales carefully and consider cultural interpretations of terms like “neutral” or “satisfied.” What resonates in one region may not translate directly into another.
Best practices for using ordinal scales
When using ordinal scales, clarity and consistency are key to collecting reliable data. Here are some essential practices to follow:
- Balance your scale points: Use symmetric options such as “Very dissatisfied” to “Very satisfied” to avoid introducing bias.
- Choose clear, neutral labels: Avoid vague or emotionally charged wording that could skew responses or reduce reliability.
- Stick to one scale format: Mixing 5-point and 7-point scales in the same survey can confuse respondents and complicate analysis.
Following these practices helps ensure higher-quality data and makes your survey results easier to interpret and act on.
How Kantar helps design surveys with ordinal scales
The Profile’s team at Kantar works with clients to:
- Select the right ordinal scale type based on research goals.
- Structure survey questions for clarity, balance, and reliability.
- Ensure cultural relevance and consistency across global audiences.
Whether it’s tracking satisfaction, ranking brand perceptions, or exploring emerging market trends, Kantar ensures that your ordinal scale questions deliver precise, actionable data.
Putting ordinal insights into action
Ordinal scales may not provide exact numbers, but they offer something just as powerful: a structured way to capture how people think, feel, and prioritise. They reveal direction, order, and preference—all of which are essential for guiding decisions in business and research.
By applying the right design practices, analysis methods, and visualisations, researchers can turn ordinal data into meaningful insights that inform marketing strategies, product development, and customer engagement.
Want to learn more?
Speak to our expert research directors to learn how we deliver data from online research panels via flexible survey solutions that you can act with, quickly.