
Headline results for the service in Australia are now available for the second quarter of 2022:
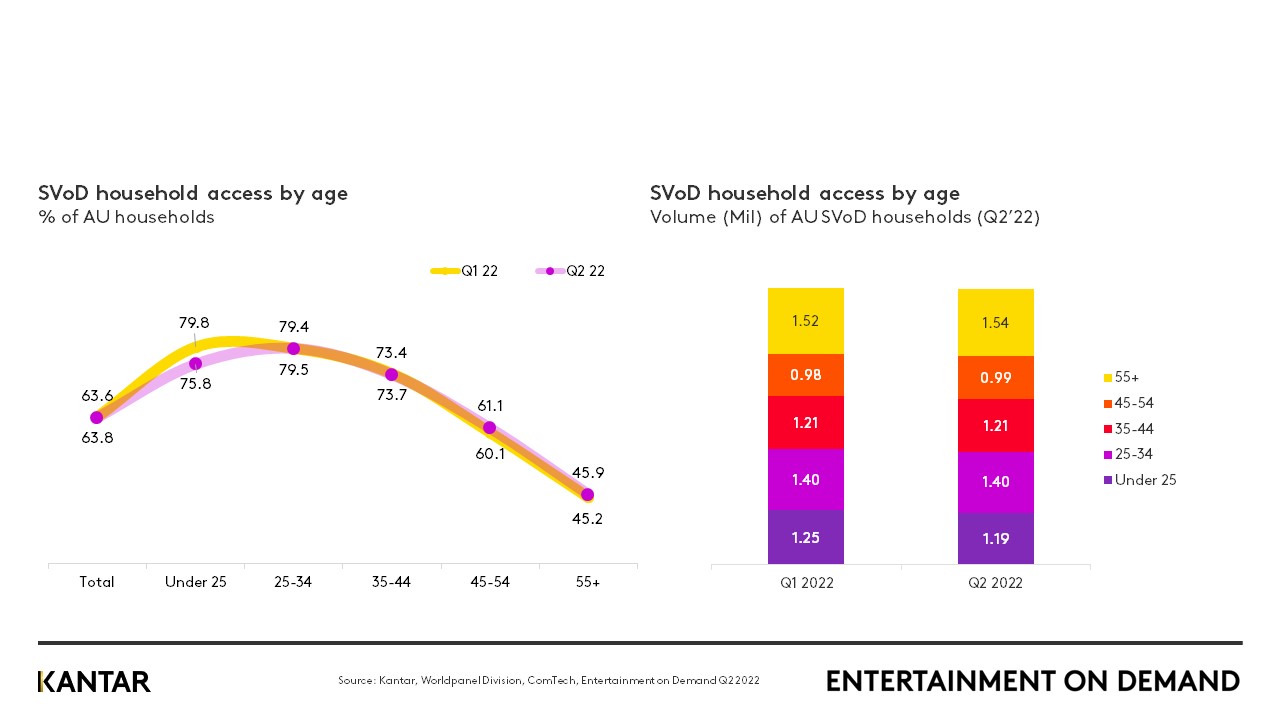
- 6.3 million Australian households subscribe to at least one video streaming service in Q2 22. Whilst total market penetration remained broadly static compared with Q1 22 at 63.6% of households, those households with under 25-year-olds present in the home saw a fairly steep decline in penetration of 4% points, or -62,000 households, as the cost of living continues to rise and soaring prices force consumers to find ways of saving money.
- Netflix remained by far the dominant provider, however, Kantar data shows that among homes with at least one subscription service, Netflix share has fallen from 80% in Q1 22 to 78.8% in Q2 22.
- 666,000 Subscription Video on Demand (SVoD) services were cancelled in Q2 22, with a further 16% planning to cancel a service.
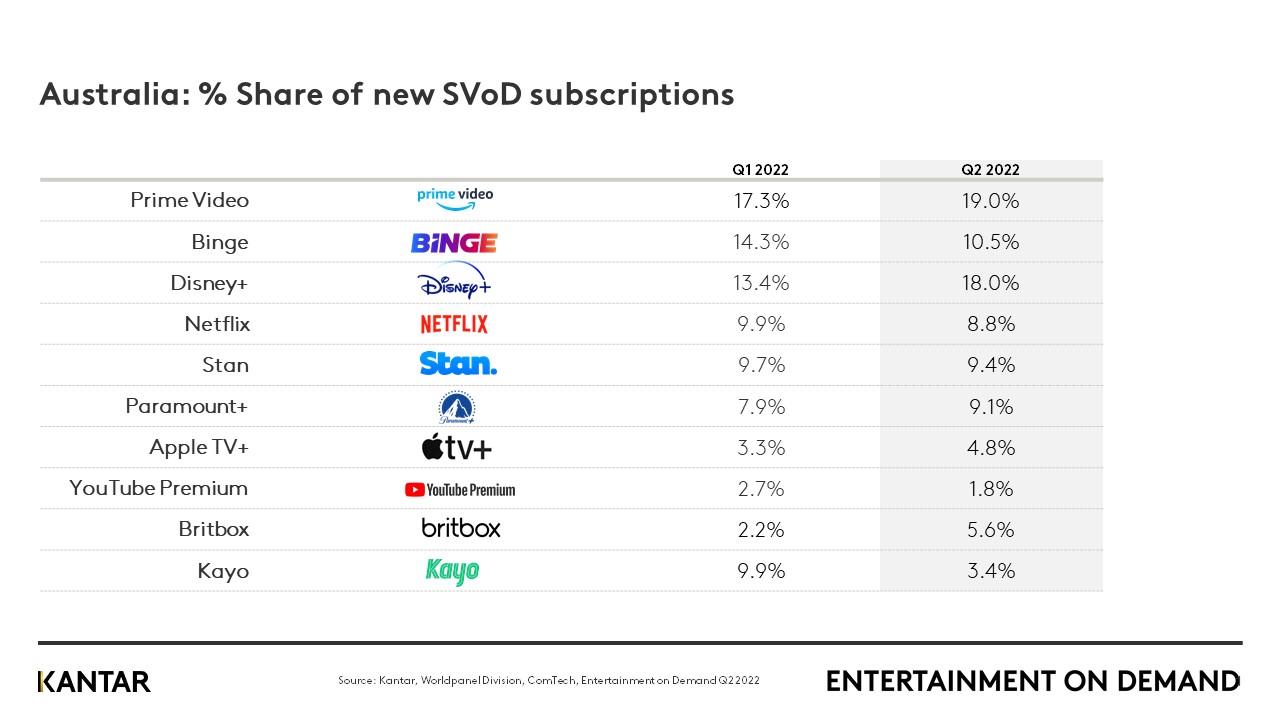
- Just under 4% of households signed up to a new video streaming service in Q2 22. Amazon Prime Video and Disney+ command the highest shares of new subscriptions this quarter at 19% and 18% respectively with both services enjoying share growth quarter-on-quarter.
Younger homes suffer a sharp decline in SVoD subscriptions
SVoD penetration stood at around 80% in Q1 22 among under 25 and 25- to 34-year-olds, however, as can be seen in the chart below, the proportion of under 25-year-olds accessing SVoD services in Q2 22 has dropped by 4% points down to 76%. This equates to 62,000 fewer households with an SVoD subscription, where under 25-year-olds are present in the home.
By provider, those services faring best among this demographic are Disney+, with share growing quarter-on-quarter by 1% point to 40.3% and Stan, with share up by 0.8% to 23.3% (around half of subscriptions with these providers among under 25-year-olds are paid for by someone else). Additionally, this age group are the most frequent viewers of BVoD channels such as Nine Now, Ten Play and SBS On Demand – against a market average of almost 13% of households watching these channels on a daily basis, under 25-year-olds’ daily usage of BVoD channels rises to 20%, with nearly half of those watching for 3 or more hours per day.
Cancellations
666,000 services were cancelled in Q2 22 with 37% doing so to save money, higher than any other factor, with a similar proportion scrapping their Netflix service for this reason. Despite just 10% of all cancellations being due to price rises and consumers’ unwillingness to pay, this figure almost doubles among those cancelling Netflix.
A further 16% of current video on demand households plan to cancel a subscription and, whilst the top reason in the market remains the desire to save money, cited by 26% of households, several other factors around lack of new content, difficulty in finding it and, therefore, infrequent use or disengagement of the service also play a part. However, another factor stated by 15% of all households looking to cancel is that they signed up to watch specific content and, once it has been viewed, they go on to cancel the service – this is by far the greatest reason for Paramount+ carrying one of the highest rates of planned cancellations at nearly 14% – almost 60% of sign-ups to the service in Q1 22 were for specific content, principally 1883 and Star Trek. This highlights the need to broaden appeal for or awareness of its wider catalogue in order to retain these customers. Conversely, among households intending to take out a new subscription in the next 3 months, 13% intend to sign up with Paramount+, the second highest rate of purchase intent after Disney+.
Prime Video leads in take-up of new services
Almost 1 in 5 new services taken out this quarter were with Prime Video, with over one third of new subscribers signing up for specific content, such as The Boys. The number of Amazon Prime subscriptions continues to grow, reaching almost 29% of households and, whilst video is by far the most popular service, used by 73% of Prime subscribers, more substantial growth has been seen quarter-on-quarter in usage of Prime Delivery and Prime Reading at 31% and 11% respectively, driving the perceived value for money which households are otherwise signing up for. Value for money, incidentally, is the top driver of satisfaction among Prime Video customers, far outperforming all other service providers.
Obi-Wan Kenobi is the most enjoyed title
Disney+ accounts for 18% of new subscriptions this period, with over 40% signing up for specific content, with key titles being Obi-Wan Kenobi and Marvel films. Obi-Wan Kenobi is the title most enjoyed by and the most recommended to all SVoD households this quarter, leading to the highest degree of satisfaction with the amount of original content offered by this service, as well as driving up the number of SVoD homes which have a Disney+ subscription to 31.2%. With Obi-Wan Kenobi topping the list of recommended content, Disney+ earns the highest rate of purchase intent among those households looking to take out a new subscription in the next 3 months at 17%.
The proportion of new subscriptions taken out by gateway subscribers, those households completely new to the category, remains significant but falls quarter-on-quarter to 32% (from 34% in Q1 22), as more SVoD households stack their subscriptions. The stacked subscriber segment grew to 41% and the average number of SVoD subscriptions held grew slightly to 3.5. The proportion of new subscriptions taken out by switchers, those replacing an existing service with a new one, is stable at 16%, indicating that competition between the streaming providers is strong.
Access the interactive data visualisation for more information.