
The latest grocery market share figures from Kantar show year-on-year supermarket sales grew by the fastest rate in over a decade during the past 12 weeks – increasing by 7.6%. The rate of growth in the most recent four weeks was nearly three times higher at 20.6%, making March the biggest month of grocery sales ever recorded.
It has been an extraordinary month and social distancing measures have had a profound impact on all our daily lives – from the way we work and socialise, to how we shop and care for our loved ones. Retailers and their staff have been on the frontline as households prepare for an extended stay at home, with grocery sales amounting to £10.8 billion during the past four weeks alone – that’s even higher than levels seen at Christmas, the busiest time of year under normal circumstances.
While week-on-week sales were growing strongly at the beginning of the month, it was on Monday 16 March that the public headed to the shops in unusually high numbers. Between Monday 16 and Thursday 19 March, 88% of households visited a grocer, making five trips on average – adding up to 42 million extra shopping trips across four days.
Growth has been primarily driven by people making additional shopping trips and buying slightly more, rather than a widespread increase in very large trolleys. The average household spent an extra £62.92 during the past four weeks, equivalent to adding five days worth of groceries. Shoppers in London, where the outbreak is reported to be a few weeks ahead of other regions, increased their spending the most, up by 26% during the month.
It’s inevitable that shoppers will add extra items to their baskets when faced with restrictions on their movement and possible isolation if one of them becomes unwell, but many families are also adjusting to having more mouths to feed. Those with children over the age of 16 spent £508 this month on average, £88.13 more than they did in March 2019 – a trend that likely reflects students returning home from college and university.
With restaurants and cafés now closed, none of us can eat meals on the go any longer and an extra 503 million meals, mainly lunches and snacks, will be prepared and eaten at home every week for the foreseeable future. Those already missing their favourite haunts have been stocking up to recreate trips to the pub with friends over apps like Houseparty and FaceTime – boosting alcohol sales by 22%, an additional £199 million in the past month. Purchasing of food and drink items for store cupboards rose by 28% during the past four weeks and by the same again for frozen goods.
Convenience stores appeared to benefit from people shopping more often and following guidance to stay closer to home. Collectively, smaller branches of the major retailers and independently-owned outlets increased their share of spend to 13.3%, growing sales by 30% compared with the same four weeks a year ago.
Grocery spend online was 13% higher than the same period in 2019 and the average online basket size surged to £81.88 this month, over £6 more than in March 2019. Government advice may have been to get groceries delivered if possible, but limited delivery slots meant that only 14.6% of households received an online delivery in the past four weeks, up from 13.8% in March 2019 but probably well below actual demand.
Most of us still relied on the full-size, bricks-and-mortar stores operated by Tesco, Sainsbury’s, Asda, Morrisons, Waitrose, Aldi and Lidl. They took 76% of spend through their tills in the past four weeks, with sales 19% higher than March 2019.
Looking ahead, we expect restrictions on movement and relatively full grocery cupboards will mean the incredibly high levels of shopping trips made in March will drop off over the coming weeks. Regular trips to smaller local stores are likely to continue, as people avoid travelling and queues at stores with one-in-one-out policies in place. Sales of long life and non-perishable items will slow as households work their way through stocks and consumers will focus on replenishing their supply of fresh foods.
While much-reported panic buying has been concentrated to a relatively low number of individuals so far, we anticipate that this too will subside as consumers gain confidence in the retailers’ abilities to maintain grocery supplies and keep stock on the shelves.
An update on the grocers
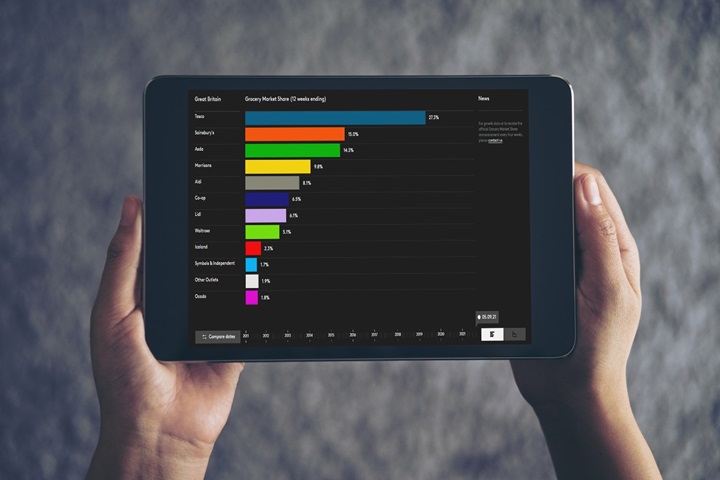
During a time of unprecedented demand, all ten of the largest retailers were simultaneously in growth during the past 12 weeks – something we haven’t seen since October 2018. Meanwhile, independent retailers and symbols, which includes Spar, Nisa, Premier, Londis and Costcutter, provided welcome access to groceries close to home, and sales rose collectively by 16.1% this period.
Lidl’s sales were up 17.6% during the 12 weeks, as its market share increased by 0.5 percentage points to 6.1%, while Aldi reached a new record high market share of 8.2%, growing sales by 11.0%.
With growth of 7.4%, Sainsbury’s was the fastest growing of the traditional big four this period, followed by Tesco at 5.5%, Asda at 4.9% and Morrisons at 4.6%. Iceland benefited from shoppers stocking up on frozen items, with sales up by 11.7%. Its market share rose to 2.2%, up by 0.1 percentage points on last year.
Co-op’s extensive number of convenience outlets helped to attract people looking to shop locally and its sales increased by 9.4%, while Waitrose’s sales grew at the fastest rate since November 2013, up by 7.5%.
Despite a temporary halt on deliveries to new customers in March, online specialist Ocado still acquired 133,000 new shoppers during the past 12 weeks, helping it boost sales over the same period by 12.5%.
Notes for editors
Please note that four week ending or six week ending retailer share data should not be used in media reporting. The 12 week ending data stated in this release covers a longer time period which means it is a superior indicator of retailer performances and trends. Kantar has drawn on four-week ending data to evidence overall market trends and changes in shopper behaviour in light of the coronavirus outbreak and to give a more accurate picture of this fast-changing situation.
These findings are based on Worldpanel FMCG data for the period to 22 March 2020. Kantar monitors the take home grocery purchasing habits of 30,000 demographically representative households across Great Britain. Kantar grocery market share data includes all expenditure through store tills, excluding petrol and in-store concessions. All data discussed in the above announcement is based on the value of items being bought by these consumers.
For all publicly-quoted data, users of our research (including media) must ensure that data is sourced to ‘Kantar’.
Retailer growth figures reported by Kantar relate to overall take home sales, and so include the impact of store openings or closures. Like-for-like sales change is not measured or reported. Calculating like-for-like sales requires a detailed knowledge of store openings and extensions which is information held accurately only by individual retailers. Kantar will only support data that is published in the context we have presented it and our own interpretation of these findings. Our commentary is based upon our own data and information in the public domain. We cannot be held responsible for any other interpretation of these findings.
An update on inflation: Grocery inflation now stands at 0.9%† for the 12-week period ending 22 March 2020. Prices have been rising since the 12 weeks to 1 January 2017, following a period of grocery price deflation which ran for 30 consecutive periods from September 2014 to December 2016. Prices are rising fastest in markets such as sausages, oral analgesics and fresh bacon rashers.
† This figure is based on over 75,000 identical products compared year-on-year in the proportions purchased by shoppers and therefore represents the most authoritative figure currently available. It is a ‘pure’ inflation measure in that shopping behaviour is held constant between the two comparison periods – shoppers are likely to achieve a lower personal inflation rate if they trade down or seek out more offers.