

Worldpanel’s Entertainment on Demand study in Australia uncovered the following behaviours within the Video on Demand (VoD) market in the first quarter of 2023:
- According to our data, 61.5% of Australian households subscribed to at least one video streaming service in Q1’23, representing an increase of 10,000 households compared to the previous quarter, bringing the total to 6.12 million households.
- 4.5% of households subscribed to a new video streaming service in Q1’23, resulting in a total of 1.34 million new subscriptions. Interestingly, the report shows that households are more likely to switch between services rather than stack subscriptions, with the average number of VoD services per household remaining constant at 3.4.
- 1.15 million video streaming services were cancelled between January and March 2023, resulting in a net increase of 189,000 new services for the quarter. Additionally, the proportion of households planning to cancel at least one service over the next three months has come down from 24.4% in Q4’22 to 23% in Q1’23.
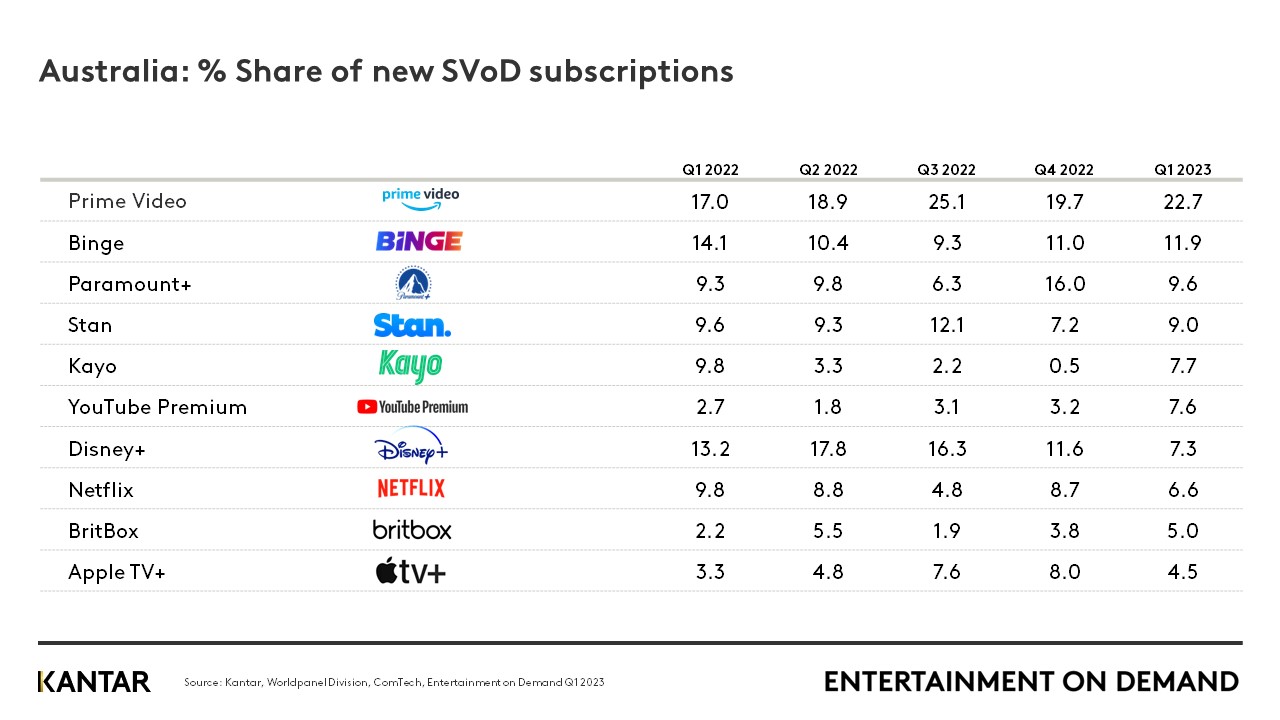
- When it comes to new SVoD subscriptions, Amazon Prime Video took the highest share, with its share growing quarter on quarter to almost 23%. Binge followed in second place with share up to 11.9%, while Paramount+ dropped to third place with 9.6% share after a particularly strong Q4’22. Share growth is also seen for Stan and YouTube Premium (with free trials growing strongly as a key trigger to sign-up for both services), Kayo (NRL and AFL season launches) and Britbox. Despite an increase in take-up of Basic with Ads to 18% of new Netflix services this quarter, Netflix share of all new subscriptions drops back this quarter to 7.5%, or 6.6% within the SVoD market only.
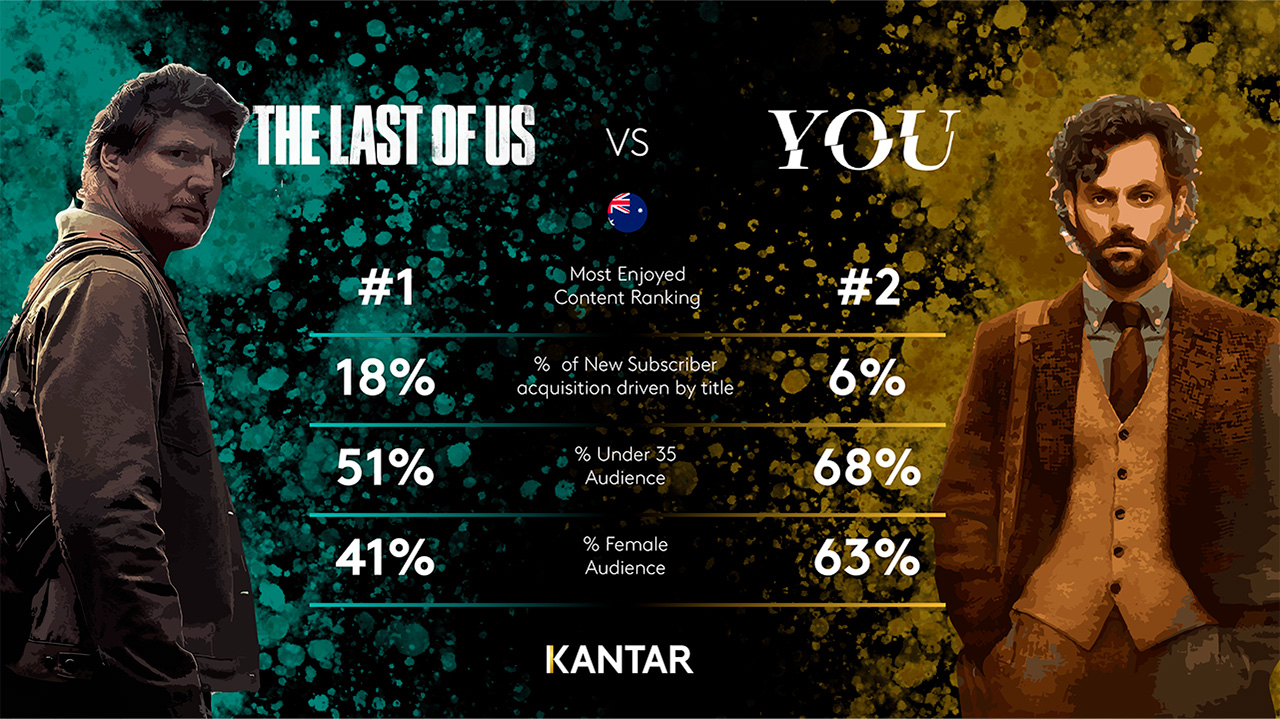
- The Last of Us was the most recommended and most enjoyed SVoD title in Q1’23 and was the top title driving acquisition of new Binge customers, with Netflix’s YOU and Wednesday the next most enjoyed titles for the quarter.
Reducing costs and maximizing value remain top priorities for viewers
Although the total number of service cancellations has decreased to 1.15 million, the desire to save money is becoming an increasingly popular reason for cancellation, rising from 37% in Q4’22 to 41% in Q1’23. This is particularly true for customers of Stan, Disney+ and Netflix. Furthermore, 30% of cancellations are due to households not regularly using the service and feeling that they are not receiving the desired value. Apple TV+ has the highest rate of churn, with 22% of its customer base cancelling their subscription this quarter, mainly due to lack of use.
Value for money continues to be the second biggest driver of sign-up in the total market (after specific content). Almost a third of new Prime Video subscribers claim to have signed up for value for money, with this factor becoming increasingly important among all Prime Video customers. It is particularly popular among those who use more than one of the Prime services on offer and those who are signed up on an annual subscription. In fact, 48% of Prime Video customers cite value for money as the biggest satisfaction driver.
Although specific content is the primary driver for new sign-ups on Netflix, the biggest reason for signing up for the ad-supported plan, which accounts for 18% of new Netflix services, is unsurprisingly value for money, with 34% of customers citing it as the reason for signing up. This is in contrast to those signing up for the premium ad-free service, where only 28% cite value for money. Interestingly, 6% of Netflix customers have downgraded their subscription from ad-free to Basic with Ads this quarter, which may have saved them from cancelling their subscription altogether. Among those who downgraded, 13% had planned to cancel their subscription in the previous quarter, which is twice the Netflix average.
Access the interactive data visualisation tool for more information.