

Kantar Worldpanel's Entertainment on Demand study in Australia uncovered the following behaviours within the Video on Demand (VoD) market over the three months to December 2022:
- 6.11 million Australian households subscribed to at least one video streaming service in Q4’22, representing 61% of households - a decline of 38,000 households quarter on quarter (a far softer fall from the 180,000 decline experienced last quarter).
- 5% of households took out a new video streaming service in Q4’22, amounting to 490,000 households (an increase of 20,000 on the previous quarter) and a total of 1 million new subscription services were taken out.
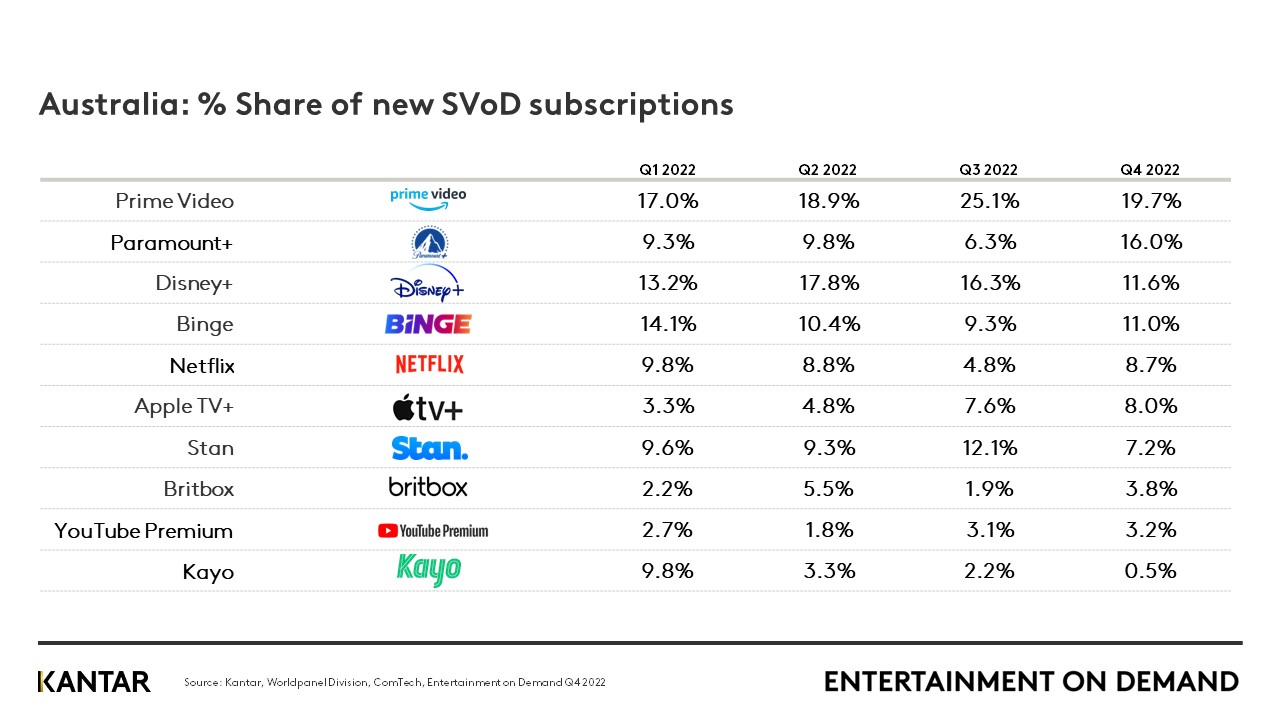
- Amazon Prime Video continues to lead in attracting new subscribers with almost 20% share, whilst considerable share growth was enjoyed by Paramount+ this quarter, accounting for 16% of new SVoD subscriptions, largely on the back of attractive Black Friday deals. Other noteworthy increases are seen for Netflix, Binge (with House of the Dragon continuing to drive sign-up) and AMC+ with its new standalone service launching in Q4’22.
- Service cancellations remained high, with over 1.3 million SVoD services cancelled between October and December 2022. Whilst a lower proportion of SVoD churners are leaving the category entirely this quarter (29%), an increasing number of households are not replacing cut services as they begin to trim their SVoD portfolio, resulting in a slight decline in the average number of SVoD services held at 3.4. Furthermore, nearly 1 in 4 SVoD households plan to cancel a service in the next 3 months.
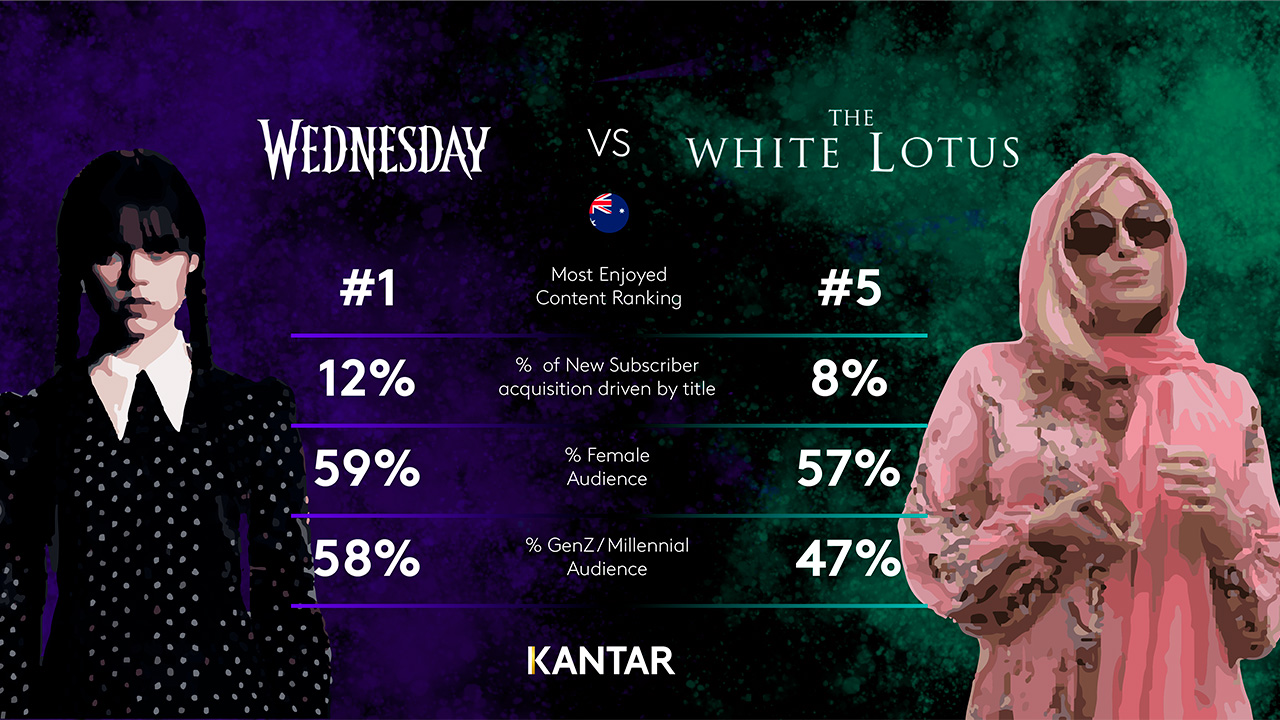
- Wednesday was the most enjoyed SVoD title in the quarter and was the top title driving acquisition of new Netflix customers. Stan’s Yellowstone was the next most enjoyed title and, among the 30% of new customers signing up to Stan for specific content, around 1 in 4 did so for the Yellowstone series.
Increasing sign-up to Amazon Prime fuels growth in Prime Video subscriber base
The proportion of Australians signing up to Prime continues to grow, with 29% of households now owning a Prime membership. 70% of these Prime members actively use Prime Video with this figure stable quarter on quarter, implying that the Prime Video user base has grown in line with the increased uptake of Prime. However, the proportion of customers using their membership for the Prime Delivery service has seen the biggest increase up to 38% (up from 33% in Q3’22), undoubtedly driven by Black Friday and Christmas sales. Value for money continues to be the biggest driver of satisfaction among Prime Video customers, growing quarter on quarter, and contributing significantly to the increase in Prime Video’s NPS rating which has grown to 21ppts. Whilst this remains just below the market average of 23ppts, it is well ahead of key competitors Stan, Binge and Paramount+.
Whilst specific content is the biggest driver of new sign-ups to Prime Video (typically Lord of the Rings: Rings of Power and The Boys), factors which are increasingly driving sign-up are variety of TV series or classic films and the quality of the shows, proving that the streaming provider is already reaping the benefits of its increased investment in local content.
Tulsa King and Black Friday deals drive Paramount+ share of new subscriptions
Paramount+ share of new subscriptions leapt into second place in Q4’22, up to 16%. A big factor driving this increase was specific or exclusive content, in particular, Tulsa King, with this new drama series accounting for 13% of all new customers drawn to the platform. However, an increasing proportion of new sign-ups were driven by value for money on the back of the Black Friday deals, offering substantial discounts on monthly and annual subscriptions when signing up direct to Paramount+ or when accessing via Prime Video Channels. With around 1 in 4 new subscribers signing up for a year, the immediate threat of churn is greatly reduced and, therefore, the proportion of current subscribers planning to cancel their Paramount+ service in the next 3 months has declined in the quarter to 17.5%.
Wednesday Addams draws new customers to Netflix
Netflix share of all households accessing VoD services continues its downward trajectory, declining from 77.6% in Q3’22 to 76.8% in Q4’22, with more than half of these churners dropping out of the category completely. However, Netflix share of new subscriptions sees a welcome increase quarter on quarter up to 8.7% in Q4’22. Of the 34% of customers who took out a new service with Netflix for specific content,
Wednesday was the biggest draw, allowing Netflix to recoup some of the Gen Z and millennial customers lost in previous quarters in 2022. Wednesday was the most enjoyed title in Q4’22, with 12% of all VoD subscribers stating this as their favourite show.
So, how has the launch of the ad-supported service been received in the final quarter of 2022? Of all new services taken out with Netflix in Q4’22, 16% were the lower cost Basic with Ads plan, a cost-saving of $4 to $6.99 a month. Netflix boasts the highest rate of customer loyalty at 97%, with customer churn having dropped from 4% last quarter to 3% in Q4’22 – among the 97% remaining with the provider since Q3’22, 7% have downgraded to the ad-supported tier. Currently, it is too early to say whether or not that 7% would have churned had the lower cost tier not been introduced. However, it cannot be ignored that a far higher than average proportion of those who have cancelled their Netflix service in Q4’22 cited the need to save money as their primary reason and this figure has increased by 5ppts quarter on quarter to 46%.
Access the interactive data visualisation tool to explore current and historical SVoD market data for your region.