
Love them or hate them, scale questions (whether they’re liking, agreement, or rating scales) are such a common feature in market research.
But have you ever wondered what the best way is to analyse the results from them? Or if the way you’re doing it is the best way?
In this short guide, we talk you through 7 different ways to analyse rating scale data and what you need to know and consider when doing so.
1. Averaging
The most basic method of analysing scale question data is simply averaging the ratings given to each item like the example below.
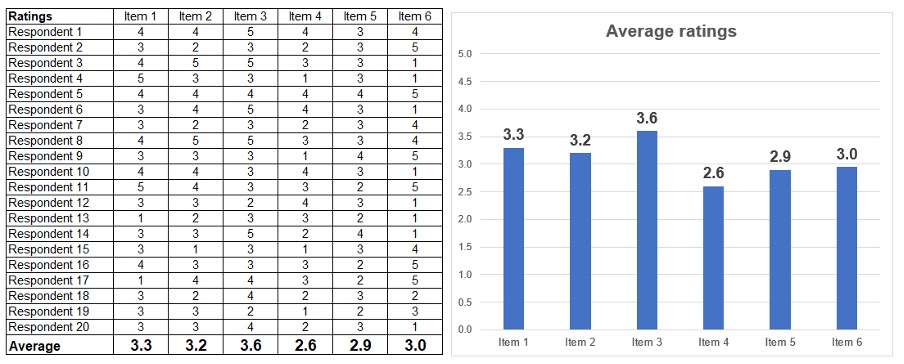
Potential problems with averaging:
The problem researchers may have with basic averaging is that this method tends to produce results that hover between very narrow ranges, making it hard to differentiate between factors. Using the results above, you may not be confident whether item 1 is actually preferred more than item 2 – as there is only 0.1 differences in the average.
2. Scoring responses
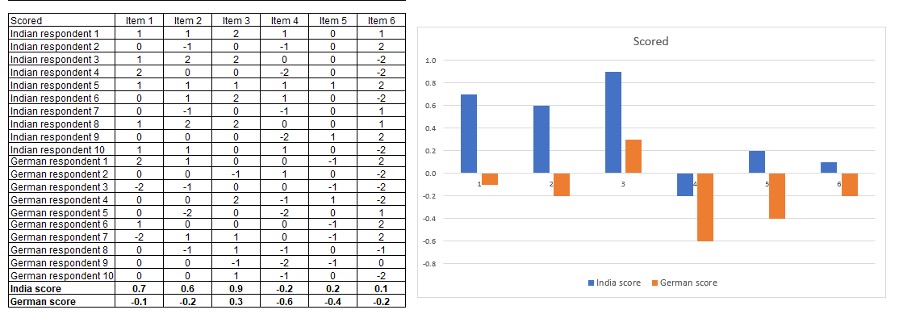
To gain clearer differentiation, a method some researchers use is to create a scoring system for the answer. Imagine these ratings are taken from a 5 point liking scale. You could create a simple scoring procedure like this:
1 Dislike a lot = score -2
2 Dislike a little = score -1
3 neutral = score 0
4 Like a little = score 1
5 Like a lot = score 2
Doing so would produce results that look like the below from the same set of answers.
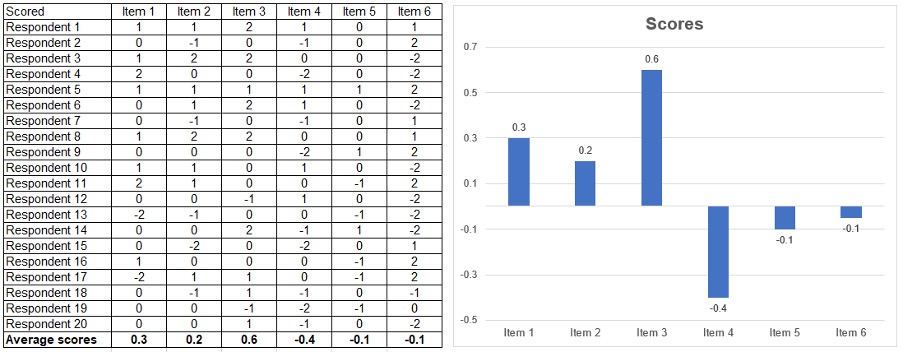
You can see in the above charts that this method more clearly differentiates the results between items – giving you confidence in this example that item 3 is the clearer “winner” and that item 1 scores measurably more than item 2 etc.
Potential problems with scoring:
Depending on what you’re trying to understand, a scoring system like this, whilst looking like it delivers a clear story, might actually provide misguided advice.
Say, for example, these are ratings of ice cream flavours and there are some flavours that divides opinions. For one flavour, many people say they ‘like it a lot’ whilst many others ‘dislike it a lot’, and the remaining are very neutral about it.
Imagine if the scores from two different ice create flavours look like this:
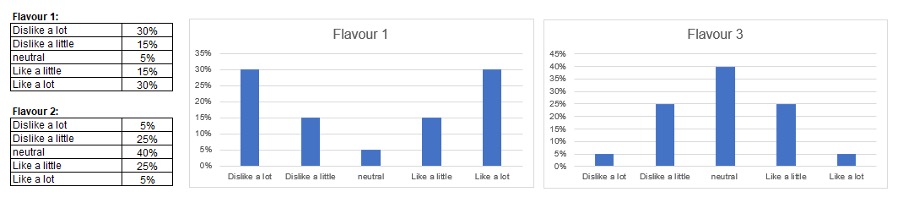
With this scoring system, both flavours would end up with exactly the same score (3 out of 5), but…
In real life, flavour 1 is likely to sell a lot more than flavour 2. Why?
When you go into an ice cream store there are usually a wide range of choices, so you don’t pick and ice cream you ‘like a little’ or are ‘neutral’ about. And you certainly don’t pick a flavour you dislike (and it hardly matters how much you dislike a flavour - you won’t choose it.) You will choose the flavour you like most and there is often many of them.
In this case, there is one ice cream that 30 people ‘like a lot’ and another that only 5 people ‘like a lot’ – and that is all you really need to know. It’s most important metric. Therefore, this scoring system isn’t ideal if you are doing this research to work out which ice cream to stock.
A more accurate scoring system in this situation might be:
1 Dislike a lot = score 0
2 Dislike a little = score 0
3 neutral = score 0
4 Like a little = score 0
5 Like a lot = score 1
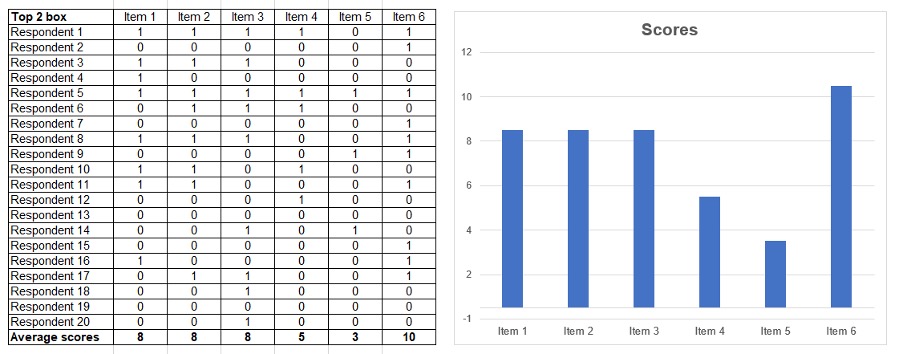
3. Top box comparison
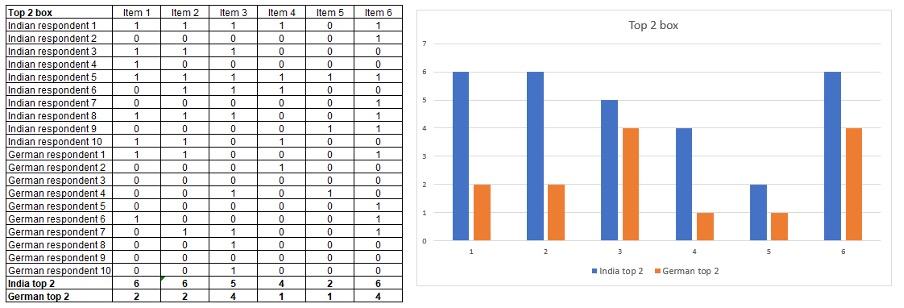
The most common way researchers summarise data from a scale question is simply adding up the number of people who selected the top choices in the scale and comparing.
When you apply this approach, it’s not item 3 that gains the highest score, it’s actually item 6.
Potential problems with this method:
This method certainly does produce clearer differentiation and a clearer picture of what the most favoured choice is. However, if this is all you are going to do with the data, it begs the question, why you’re asking the question as a scale in the first place?
If you simply want to know what the top choices are, you can find this out without having to ask people to rate each item. Simply ask respondents to, for example, pick out their preference from the set in order. There are a wide variety of choice based questioning techniques that are less boring and repetitive for respondents to answer.
Consider bottom and middle and custom scoring system
There are research circumstances where bottom answers or middle answers might be important, too. In healthcare research, for example, negative responses about attitudes towards health issue are often far more important that positive. If a politician is trying to craft a response that would not offend people with views on different ends of the political spectrum, a middle score to a statement might actually what they are looking for.
With enough outcome data, you can also create more nuance scoring systems. For example, you might be trying to understand drivers of behaviour and one measures is the quality rating of a product. When you analyse a whole load of data you find that there is quality threshold below which people will buy your product, but any higher it may not make much difference. You might have a scoring system that looks like this 0, 0, 1, 1, 1 for a 5 point scale.
The point here is that over simplified scoring systems can be misleading and often need thought and calibration and outcome calibration data to provide reliable data.
Dealing with acquiescence bias
There is a more generalised issues with all the above methods – acquiescence bias.
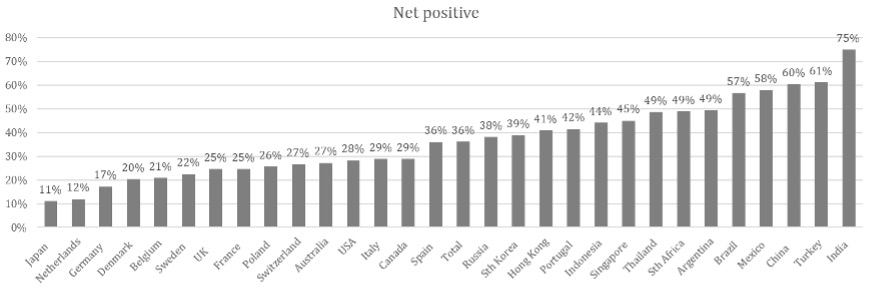
Everyone answers scale questions in slightly different ways. As a rule, younger people tend to be more enthusiastic in their scoring than older people, and people in different countries around the world tend to answer scale questions in completely different ways.
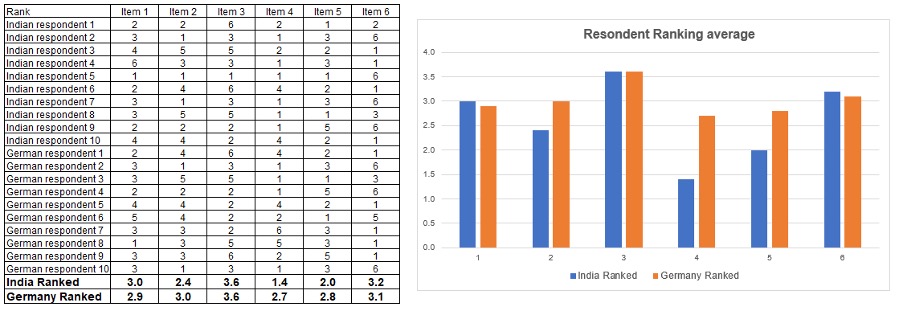
Respondent in India, for example, tend to be significantly more positive than Germans. Below is a comparison of how different people from different countries answer exactly the same set of agreement questions.
So, analysing scale data using all 3 of the above methods starts to become very difficult once you start to compare specific audiences.
Considering Indian and German audiences again, comparing average rating from each country might look like this.
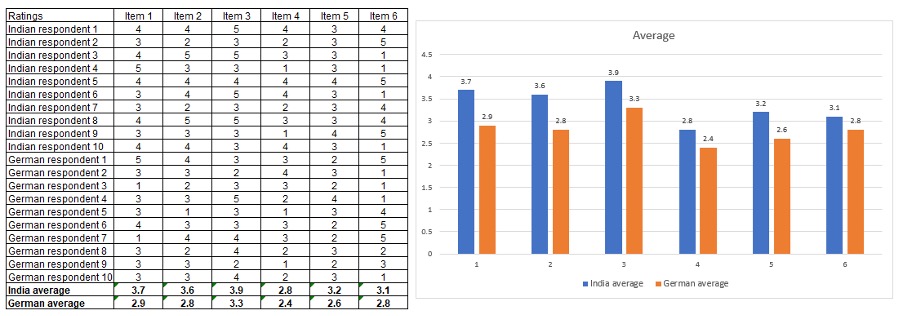
Without understanding the cultural differences, you might be led to believe that the Indian market liked all the items better than the German market.
The scoring system outline above amplifies these differences….
And the top box method results in answers that are the most highly distorted of them all because so many more people in India will select the top box option than in Germany.
4. Respondent level rank scoring
The solution that many researchers adopt is to undertake respondent level ranking of their answer.
Someone from India might have given scores for set of ice creams like these:
2, 3, 4, 4, 5, 4, 3, 4, 4
And someone from Germany might have given scores like these:
1, 2, 3, 3, 4, 3, 2, 3, 3
Both give the 5th item the highest score, but scores from the person in India are higher that than those of the German due to levels of enthusiasm.
The solution? = rank scoring
Take each person’s answers and rank them…
2,3,4,4,5,4,3,4,4 = rank score 1,2,3,3,4,2,3,3
1,2,3,3,4,3,2,3,3 = rank score 1,2,3,3,4,2,3,3
And now our answers look exactly same.
If you apply this technique to the above data set, you get results that look like this…
You can now more confidently say that the German market prefers item 4 more than the Indian market, and see that item 6 is actually the second highest rated in both markets, etc.
Applying top ranking
Once you have the ranked answers, you could apply a scoring system on the top ranked choices. It produces similar data to the top box score, but done relatively takes account of relative ranking.
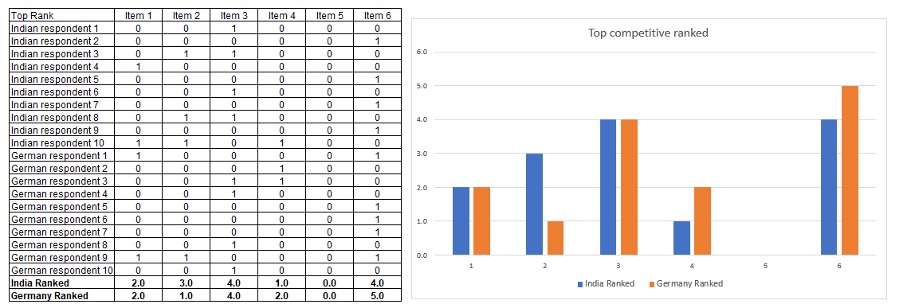
As previously stated, if this is all you plan to do with the data, then using rating scales was probably the wrong approach in the first place. You could have asked people to pick their favourite.
5. Primacy share
Now, a slightly more refined method to top ranking if you’re using rating data, is to work out the primacy share. If you simply want to predict which item would sell most in competitive context, this could be more effective.
The issue with the top ranking method is that if two items are top scored they both get “1 point”. However in reality, thinking about that as a scale, there is only a 50% chance of one of them being chosen. The way to deal with this is to divide 1 by the number of items that max scored.
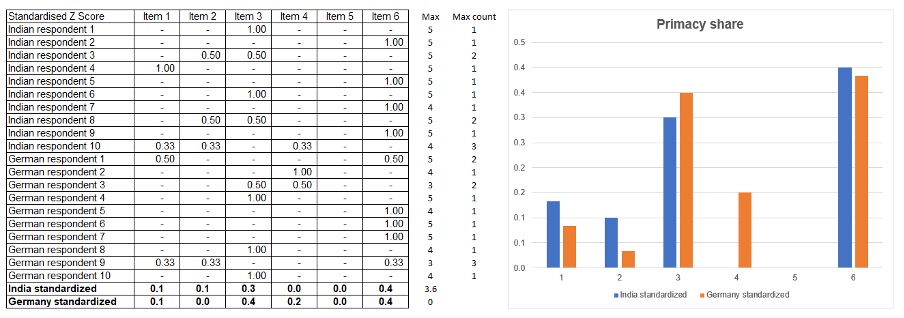
You end up with answers that look similar, but slightly more accurate. This technique is a particularly effective method of predicting market share of a competitive set of brands based on their rating.
You might note that the sixth choice in the original scoring method had one of the lowest overall rating score, but in this method it has the highest. What this reveals is that whilst fewer people like this choice, for those that do, it has less competition from other choices, and ultimately, gets selected more. This is why at Kantar, you might hear brand researchers talking about “meaningful difference” – liking of a brand does not count for everything and may not predict primacy share.
Potential problems with top ranking and primacy share analysis
Imagine you are going through this process to choose a new flavoured ice cream to sell in your store. You decide to test six new flavours and out those, raspberry is the top pick. You are then disappointed to discover that it does not sell well in the shop because people prefer strawberry (a flavour you are already selling but had not tested alongside the raspberry.) This is one of the biggest mistake researchers can make – testing outside of the real competitive context. In this case, it would have been better to test all the new flavours alongside all the existing ones.
But there may be a bigger issue at play. And that’s relying on the primacy share method for tasks where you are trying to select best performers. With this, you can get vote divide misreads.
Say for example you are testing one banana flavour and five very similar citrus fruit flavours. You might find people like all five citrus fruit flavours and therefore score them all the same, giving no one flavour primacy. The banana choice, even if less preferred may pick up a disproportionate higher share score because there might be a core group of people who like banana more. Therefore, looking a primacy data from this limited experiment like it was the most popular wouldn’t be successful.
This is an important consideration for ad testing, where you want to work out what would be the most effective ad. If you are testing some ads that are quite similar, they could suffer from vote divide and a third less effective ad may be mistakenly selected just because it’s different. In these cases, the raw relative rating score becomes far more important.
6. Standardize scoring
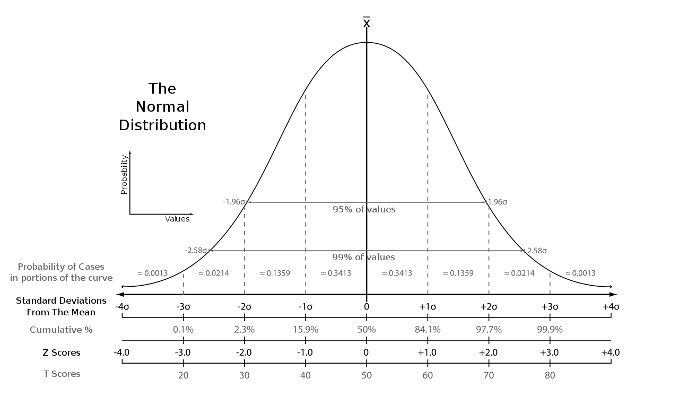
A more robust statistical approach to handle cultural bias is to use a technique called “standardize scoring” also known as the Z-score. The standard score is the number of standard deviations by which the rating score is above or below the mean value of the scores that respondent has given to all the items. Raw scores above the mean have positive standard scores, while those below the mean have negative standard scores.
Calculating it is quite simple. You average out all a respondent’s scores, and then the standard deviation. Then take each score, subtract it from the mean, and divide that figure by the standard deviation like the formula below.

The chart below is from Wikipedia if you want to read up more about this method.
This formula produces data that looks like this below. You can see that it looks pretty similar to the scoring system method above. It clearly differentiates the choices and also handles to a degree the cultural biases, so the data is easier to compare country to country.
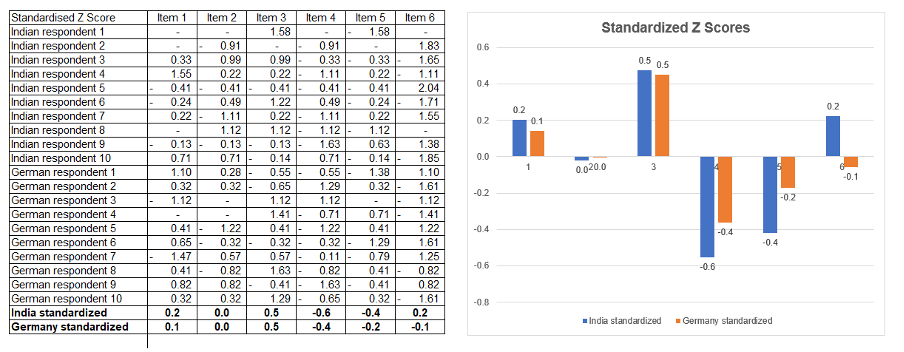
Potential problems with standardised scoring
Again, this technique is good for making intra-comparisons, but the scores will ignore overall average sentiment. However, in the process you will be capturing a respondents average score, which can be used as a comparison variable if need be. Similarly, be aware that standardised scoring nullifies an individual respondent’s range of enthusiasm.
For instance, if someone scores 1,5,1,5,1,5 to the measures and another person scores them 2,4,2,4,2,4 that difference in the level of differentiation of the first gets weighted down to match the second. Something to bear in mind when interpreting the answers.
So, what is the best method to analyse scale questions?
The answer is “it depends”. It depends on what you are evaluating. If you are doing ad testing research to work out which will be the most effective ad across a range of markets or demographics, a Z-scoring method might be recommended. But if you are trying to predict market share from brand tracking data or model real life behaviours, ranking or share primacy methods might be more efficient.
There is not really any best solution, but a recommendation to mix and match these measures for the task in hand. Think carefully about what you actually want to uncover and consider using a combination of measures that help tell the whole story and not just one.
…and is well worth thinking about this before you even do any research as it will determine how you ask the question in the first place – which may not actually be using a scale question.
Learn more about scale questions
Try our short Survey Design Training Modules to learn about designing effective scale questions, and the effect scale designs can have on answers.
Subscribe for research advice
Our experts are providing monthly research tips on survey design best practices, analysing survey data and more. Subscribe using the form below.