
When surveys are designed with engagement in mind—using thoughtful phrasing and encouraging open, honest responses—the result is stronger data that leads to more meaningful insights.
As part of our continued focus on best practices in data collection, the Profiles team at Kantar ran some research-on-research experiments to test the impact on responses of different question techniques and the level of survey engagement across different panel sources. Certain questions were seen by 500 respondents per cell per market.
We asked consumers about their thoughts about AI technology, using both basic and more thoughtfully optimised survey formats. The goal? To measure how question design influences the quality of responses.
We wanted to understand: How does question design shape what people say, how much they say, and whether they stay in the survey at all?
Let’s dive into some of the key findings.
Giving respondents a choice: The survey opt-out experiment
AI can feel abstract, confusing, or intimidating for many consumers. To avoid high drop-off rates, we tested whether giving people the option to opt out—rather than simply abandoning the survey—would surface more insight.
We began by asking participants if they were interested in sharing their views on AI before launching into the full questionnaire.
To test this, we asked respondents if they were interested in sharing their thoughts about AI before taking the full survey.
The result? To our surprise, we found that 10% in fact did drop out.
We also saw some notable demographic trends:
- 60% of opt-outs were women
- Opt-out rates increased with age; 35% were aged 55–64
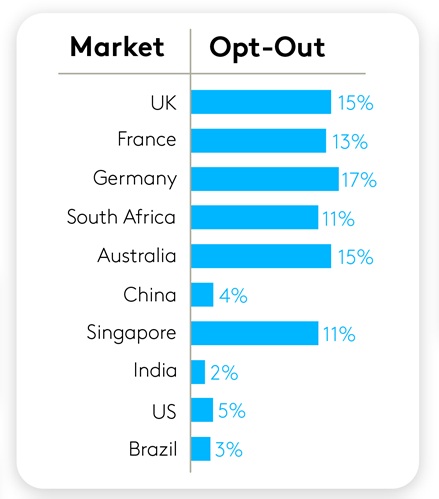
There were differences across markets as well with the highest opt-out rates occurring in Germany (17%), the U.K. (15%), and Australia (15%):
When we asked those who opted out why they chose to skip the survey:
- 40% cited unfamiliarity with AI tools
- 35% said they don’t trust or are sceptical of AI
- 31% said AI doesn’t feel relevant to their lives
These findings show there’s a need for educational materials to help audiences understand the relevance and function of AI in their lives. Given opt-out reasons varied by market, a one-size-fits all approach won't work. Brands and researchers alike should consider tailoring messaging and examples by region and audience to ensure relevance—and offer easy off-ramps when needed.
Fun isn’t always functional: The movie quiz experiment
In another experiment, we tested whether a light, engaging question could increase interest in the survey. We added a quick quiz up front—asking respondents which sci-fi movies feature AI characters. Half of the participants saw the quiz before the opt-out question; the other half saw it after.

Surprisingly and counter to our expectations, those who saw the quiz first were more likely to drop out at a ratio of 60:40.
And while those who opted out selected about 50% fewer movies in the quiz, there were no meaningful differences across gender, age, or market.
So what happened? Even well-intentioned design choices can backfire. What we think of as “fun” might come across as effort or noise to a respondent. This is a good reminder for brands using gamification, personalisation, or interactive elements—always test your assumptions. In short, even well-intentioned survey design choices can backfire if they don’t align with user expectations.
Encouraging longer responses: The power of positive feedback
Open-ended responses offer rich insights, but only if participants feel motivated to answer thoughtfully. Following up on from some research on research the Profiles team at Kantar has conducted in other surveys, we tested whether simple feedback tools like a word counter and star-rating system could increase response length.
Half of our respondents were asked, “What does the very expression ‘AI’ mean to you?” in a standard open-text box. The other half saw the same question, but with a star rating (up to five stars) and a character counter.
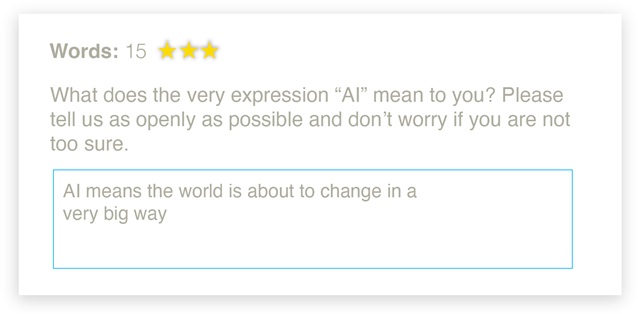
The result: The enhanced format increased response length by 21%, with an average of 68 characters per answer.
A word counter or other visual cues can meaningfully shape respondent engagement. For brands collecting feedback—whether through survey tools or customer support channels—adding gentle nudges like counters, progress indicators, or suggestions can encourage users to provide richer, more thoughtful open-ended responses.
Avoiding bias: The case for clearly labelled response scales
In the final experiment, we explored how response scale design affects answer quality. Two questions in the survey asked respondents how experienced and how comfortable they were with AI.
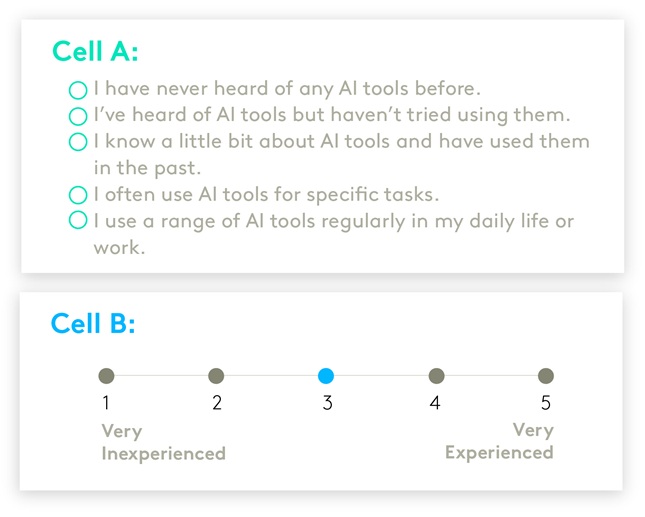
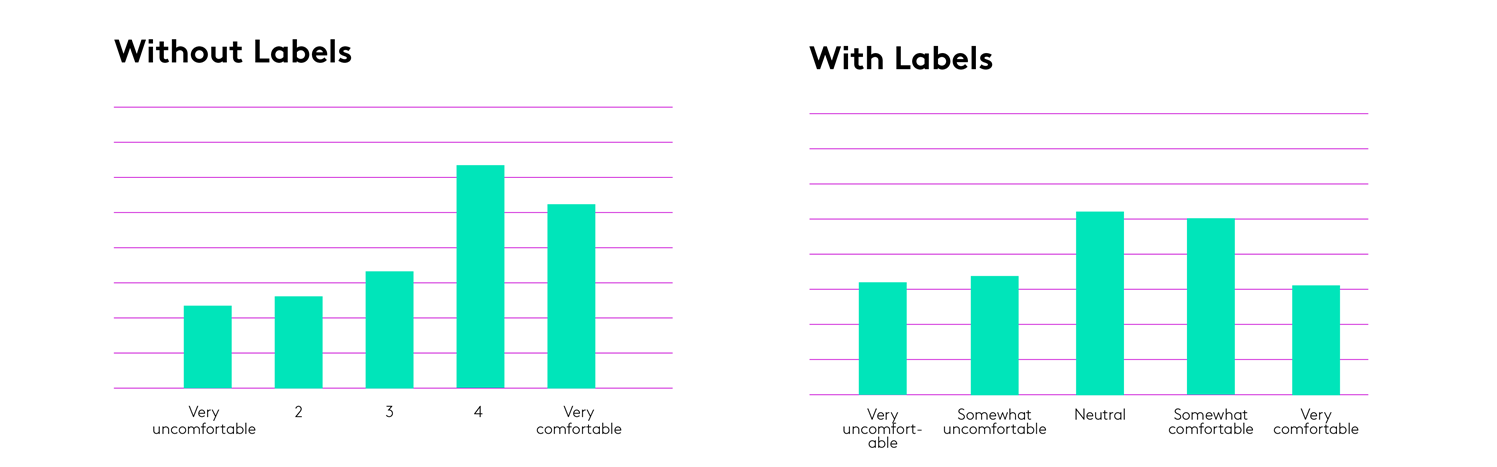
In each case we split the sample and asked half the question on a simple 1-5 scale with only the end points labelled, and for the other half we put explicit labels on each of the five points.
An example can be seen here below:
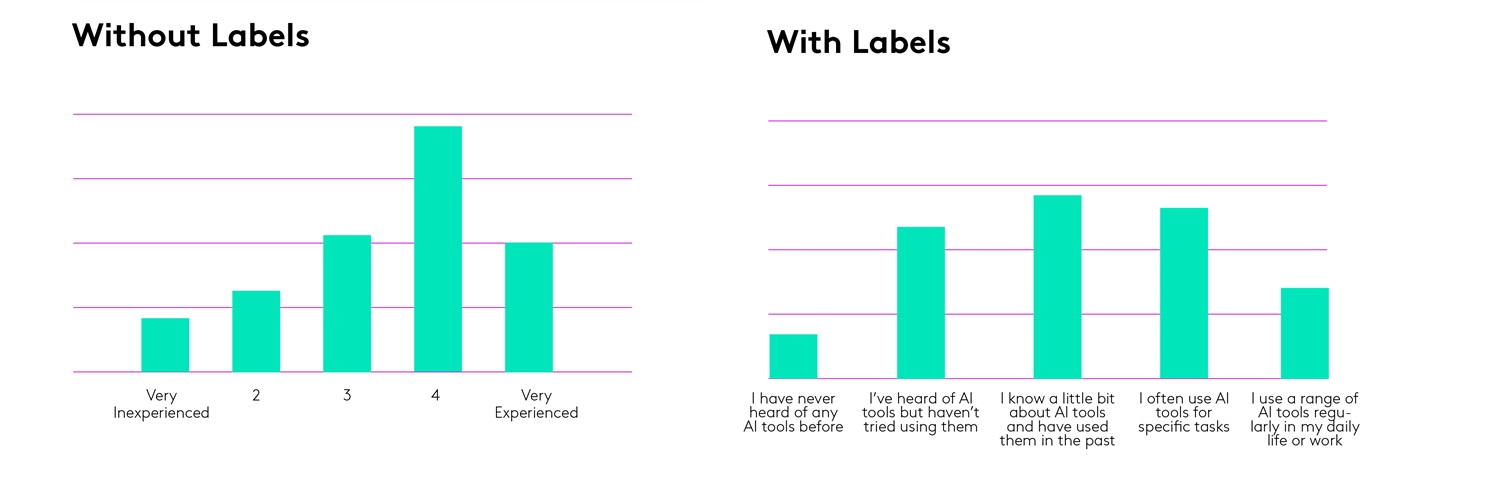
The difference was striking.
The unlabelled scale showed a noticeable spike in the fourth response point—what’s often called “acquiescence bias.” When unsure, respondents tend to choose what feels safest or most neutral.
The labelled scale, on the other hand, produced a more even distribution across options.
We saw the same pattern in another question about respondents’ comfort discussing personal or emotional topics with an AI tool: unlabelled scales skewed results; labelled scales yielded more balanced, thoughtful responses.
The takeaway? For anyone designing a survey, this means that vague or ambiguous response scales can lead to skewed results. Giving clear reference points help respondents to answer confidently.
What is empathetic survey design?
Empathetic survey design is about reducing friction, increasing trust, and creating space for respondents to share honest and thoughtful answers. That means:
- Using plain language
- Offering relatable examples
- Minimising unnecessary effort
- Giving respondents a sense of agency
These techniques don’t just improve the survey experience. They improve the data.
By applying empathetic design across our AI survey, we got a more accurate picture of how global consumers view and use AI. And just as importantly, respondents walked away with a more positive experience.
Get more answers
For more findings from this study, access the complete Connecting with the AI Consumer report. Here you’ll find additional insights into how global consumers are turning to AI, the trade-offs they’re willing to make, and what they expect in the future.
About this study
This research was conducted online among more than 10,000 consumers across ten global markets (including Australia, Brazil, China, France, Germany, India, Singapore, South Africa, the UK, and the US between April 11th through May 2nd, 2025. All interviews were conducted as online self-completion and collected based on controlled quotas evenly distributed between generations and gender by country. Respondents were sourced from the Kantar Profiles Respondent Hub.