

Key Takeaways
- Quantitative data collection focuses on gathering numerical, measurable information (e.g. counts, ratings) that can be analysed statistically - in contrast to qualitative methods, which emphasise descriptive, contextual insights.
- Surveys are the most common and versatile quantitative data method, offering scalability, flexibility in format, and relatively high response rates.
- Interviews can also collect quantitative data, offering more control and human interaction, although they tend to be more resource-intensive.
- Connected data can enrich insights and help validate or extend findings.
Reliable data is a critical element for many major decisions in business. Whether you want to create a highly targeted product, elevate your brand, or better understand your customers, data collection is the ultimate starting point. Quantitative data serves you with many concrete, numerical facts that can be used to drive some of the most vital business initiatives.
What is quantitative data? What are the best quantitative data collection methods? What are quantitative data questions? Find out the answers to all this and more below.
What is Quantitative Data?
Quantitative data collection is the act of collecting numerical consumer insight data that translates easily into statistical or quantifiable information. Quantitative data collection methods include surveys, questionnaires, observations, and more. Further, this type of data collection typically involves a substantial number of respondents. This larger pool of people provides a large enough sample of extractable data to be statistically relevant for a more sizable population.
While quantitative data is focused on extrapolating numerical data, the purpose of qualitative data is more about collecting contextual or descriptive information from a pool of people. In simpler terms, quantitative data questions usually objective and answers questions about who, what, when, and where by looking at measurable numbers. However, qualitative data extracts more subjective information, such as why.
Why is Quantitative Data Important?
Quantitative data is important for researchers due to its objectivity and ability to convey concrete numerical data. It generates reliable, factual data that can be used to answer important questions and quantify specific problems, theories, or hypotheses. Quantitative data bears importance in numerous arenas, including medicine, socio-economic studies, and experimental research. However, it is often used to guide a brand's product development efforts, deny or confirm hypotheses about product reception, or tailor marketing messages to a target audience.
By answering specific questions about its target market, a brand has verifiable datasets that can be used in innumerable ways. For instance, an up-and-coming electric vehicle (EV) manufacturer would greatly benefit from broad data points like only 3% of car owners in the US drive EVs or that 35% of people in the UK are considering buying an EV.
Quantitative data collection also allows brands to garner insights from large sample sizes. Quantitative data can be easier to collect from large groups of people. This affords the ability to break down information into smaller datasets based on important demographics like age groups, geographic locations, or other attributes of interest for comparison and analysis.
Quantitative vs Qualitative Data
Both qualitative and quantitative data are important, but the two forms of data are significantly different. As mentioned above, quantitative data is used to collect concrete numbers that can translate to reliable, statistical information. By contrast, qualitative data is more fluid and contextual.
A few important differentiations between quantitative and qualitative data include:
- Research Methods: Quantitative data collection methods involve a more close-ended approach, while qualitative data collection methods tend to be more open-ended, time-consuming, and interactive.
- Scope: Because quantitative data collection is more straightforward and quicker, the scope of respondents can be vast. For example, one multiple-choice survey may garner responses from thousands of people. Qualitative data is most often conducted with smaller sample sizes and may only be relevant to a narrower audience.
- Types of Data Yielded: Quantitative data delivers clear, objective data like specific counts or numerical measurements. Qualitative data is more subjective, and based on less-concrete concepts like behaviours, perceptions, and motivations.
- Analysis Methods: Quantitative data is simple to interpret, analyze, and graph because it is based on numerical values. Qualitative data, however, requires a more subjective analysis process, which can generate room for bias or human error.
Quantitative and qualitative data can be exceptionally valuable when paired together. For example, an online marketing firm could benefit from knowing how many people prefer websites with interactive content (quantitative). Yet, they can also make valuable decisions if they know why people prefer to interact (qualitative). In many cases, research efforts combine quantitative and qualitative data because combined, the two forms of data provide a fuller picture.
Quantitative Data Collection Methods
Quantitative data is undeniably important for concrete, numerical information. The next question is, how is quantitative data collected? Check out five unique quantitative data collection methods below.
Surveys
Surveys are the most common method for quantitative data collection. These basic questionnaires are a simple, effective method for collecting quantitative data and generally have a high rate of completion. Additionally, surveys can be deployed both online and offline to reach a broad spectrum of participants.
For example, a panel survey may be sent to a targeted group or general population of online panellists. These surveys generally have a high rate of response because they have opted into consumer panels for the sole purpose of taking part in research. And these surveys shouldn't take much time. Offline surveys are often more time-intensive but can be valuable for collecting data from targeted individuals or customers. Offline surveys may be in the form of a mailed questionnaire or a survey conducted over the phone.
Panel surveys involve a variety of question types, including open-ended questions, multiple-choice questions, single-choice or yes/no questions, grids and scales. Surveys are highly effective for collecting quantitative data because they are efficient, often inexpensive to conduct, versatile, flexible, and offer reliable, measurable data from large groups.
Interviews
Virtual (remote) or in-person interviews can be used for collecting quantitative data, although interviews are more commonly used for qualitative data collection purposes. Essentially, interviews are like written surveys but in verbal form. The process simply involves an interviewer going over the questions with the survey respondent.
While interviews take more time and can be more difficult to arrange, they do have their merits. For example, a face-to-face interview injects a human touch into the experience, which can be important for certain research topics. Also, interviews are more guided and controlled than surveys. The interviewer can effectively pace questions and responses to make sure the respondent is not dashing through just to finish as quickly as possible.
Observation
Qualitative research often uses observational studies, which tend to involve observing people in certain situations or scenarios. However, observation can be a valuable quantitative data collection method as well. The difference is observation for quantitative data collection purposes is wholly focused on numbers.
Generally, quantitative observation studies involve an observer who watches people in a certain situation. However, observations may also be automated, especially online. For example, observation may involve seeing how many products a shopper considers before making a selection. Or, a website analysis tool may measure how many minutes people spend evaluating furniture on a website before making a purchase.
Observation data collection is valuable because it provides specific, highly reliable insight into certain human behaviours. The collected data may be more reliable when observed in real life. For example, people may not always know precisely how many products they considered before making a purchase. However, an observational study would show a researcher exactly how many products a person considered.
Document Review
Document review is a type of secondary research commonly used in quantitative data collection. You are basically reviewing existing documentation from other data sources to find information to answer or understand a new question. For example, a researcher may analyze a collection of case studies or public records to generate broader datasets on a particular topic.
Secondary research methods like document review can be valuable because new knowledge can often be drawn from collective data sources. Further, evaluating data that already exists can be a good starting point for heightened research efforts. Ins some cases, researchers can identify knowledge or data gaps by reviewing what is already available. This is why literature reviews are such a crucial pillar of the medical research community.
Quantitative Question Types
From describing customer habits to comparing choices or uncovering relationships between variables, each quantitative question type offers a different lens for understanding your audience, and the right mix can make your survey results far more powerful. Here are a few quantitative data question types:
Relationship-based survey questions
Relationship-based questions aim to uncover connections between different variables or behaviours. For example, they might explore how customer satisfaction correlates with purchase frequency or how employee engagement impacts productivity. These questions often use rating scales or matrix formats, allowing researchers to identify trends, predict outcomes, and understand the strength or direction of relationships between key factors.
Descriptive survey questions
Descriptive questions are used to capture straightforward, factual information about respondents or their experiences. They often serve as the foundation of a survey, focusing on “what” rather than “why” or “how.” For instance, questions about demographics, product usage, or frequency of certain behaviours help researchers paint a clear statistical picture of their target audience or market segment.
Comparative survey questions
Comparative questions help researchers understand preferences or differences by asking respondents to evaluate two or more items against each other. These might include questions like “Which product feature do you find most valuable?” or “Rate the following options from best to worst.” The goal is to quantify how respondents perceive or prioritise alternatives, offering insights that guide product development, positioning, and marketing strategy.
Advanced method survey questions
Advanced method questions use more sophisticated quantitative techniques such as conjoint analysis, max-diff scaling, or experimental designs to reveal deeper insights into decision-making. These methods go beyond simple ratings to measure trade-offs, willingness to pay, or the relative importance of attributes. They’re particularly valuable in market research, helping brands predict consumer choices and optimise offerings based on real behavioural data.
Quantitative Question Formats and Examples
Quantitative surveys rely on structured question types that make it easy to collect measurable, comparable data. Each question format is designed to produce responses that can be quantified and analysed, helping researchers identify patterns, preferences, and correlations across large groups of respondents.
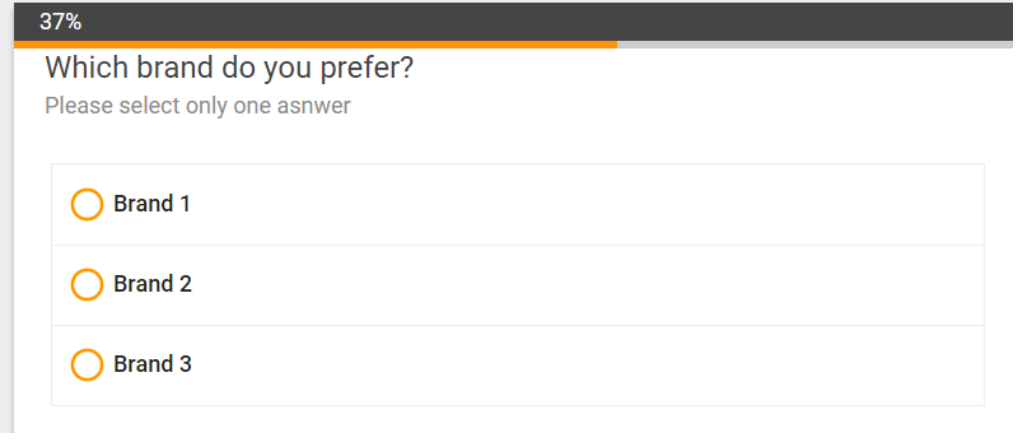
Radio buttons
Radio buttons allow participants to select one answer from a predefined list of options. This format is best suited for questions where only one choice applies, such as selecting gender, age range, or preferred product category.
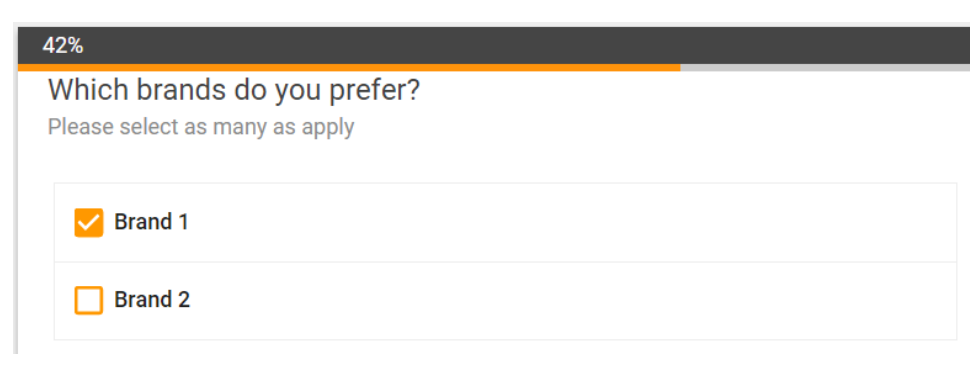
Checkboxes
Checkbox questions give respondents the flexibility to choose multiple answers from a list. They’re ideal for gathering data on behaviours or preferences that can include more than one option. For example, “Which social media platforms do you use regularly?”
Drop down menus
Drop-down menus present a compact list of options that respondents can select from. This type of question keeps surveys visually clean and organised, making it especially effective for longer lists or when optimising for mobile experiences.
Drag and drop
Drag-and-drop questions add an interactive element by allowing respondents to reorder or group items based on preference or importance. This format is often used to understand prioritisation such as ranking which product features matter most.
Likert scale
The Likert scale is one of the most common quantitative question types, asking respondents to rate their level of agreement, satisfaction, or frequency on a consistent scale. It’s useful for measuring attitudes, perceptions, and opinions with options ranging from “strongly disagree” to “strongly agree.”

Slider scale
Slider scale questions let respondents indicate their opinion or intensity by moving a slider along a continuum. This provides more detailed insights than fixed multiple-choice options, allowing for greater precision in measuring satisfaction or sentiment.

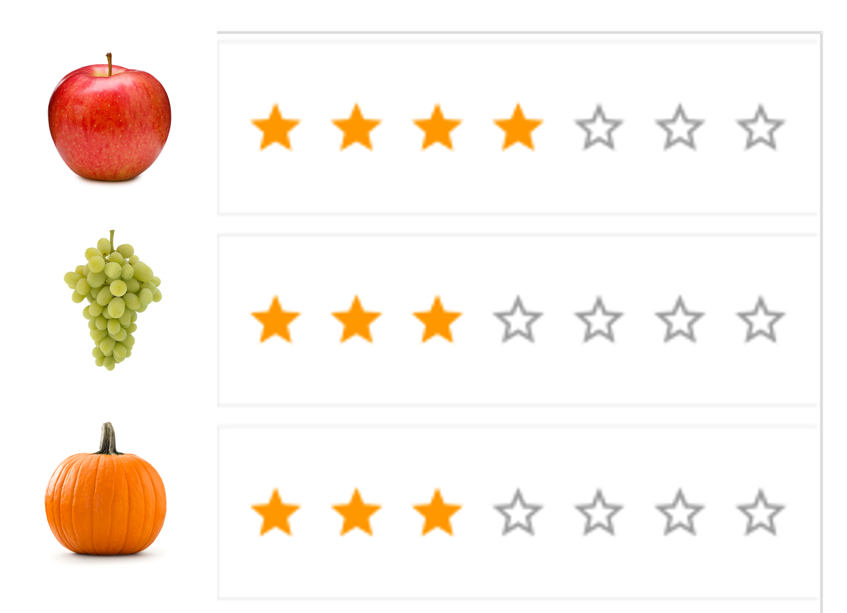
Star ranking
Star ranking questions use a familiar five-star visual format to gauge satisfaction or quality. They’re intuitive for respondents and effective for quickly comparing ratings across products, services, or experiences.
NPS
Net Promoter Score (NPS) is a standardised question used to measure customer loyalty. Respondents rate how likely they are to recommend a company or product on a scale from 0 to 10, which classifies them as promoters, passives, or detractors - offering a clear snapshot of overall customer sentiment.
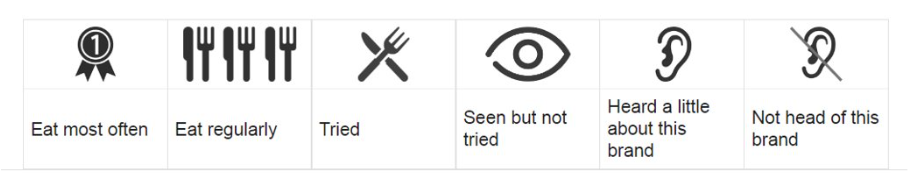
Image select
Image select questions display visuals such as product photos, brand logos, or design concepts, allowing respondents to choose their favorites. This visually engaging format helps researchers collect data on recognition, preference, and appeal while making the survey experience more interactive.
Ways to Leverage Quantitative Data
Collecting quantitative data is only the first step. The true value comes from how that data is connected, analysed, and activated to drive business outcomes. Beyond traditional surveys and observations, there are several powerful ways to maximise the impact of quantitative data once it’s collected.
1. Connected data: One of the most effective ways to elevate your quantitative insights is by connecting survey-derived data with additional first-, second-, and third-party data sources. By linking datasets through consented personal information, such as email or address, brands can create a more complete, deterministic view of their audience. This integration builds a stronger foundation for understanding consumer behaviours, preferences, and motivations.
For example, combining attitudinal data from surveys with purchase history or digital engagement data allows marketers to see not just what customers say, but what they actually do. This connected perspective deepens consumer intelligence and helps refine audience segmentation, targeting, and personalisation strategies.
2. Inform product development and innovation: Quantitative data can be leveraged to validate product concepts, identify unmet needs, and guide design decisions. By analysing numerical feedback from market surveys, brands can prioritise which features or price points matter most to consumers. This ensures that product launches are informed by real, data-driven insights rather than assumptions.
3. Optimise marketing strategies: When applied strategically, quantitative data can uncover which messages, channels, and audiences deliver the highest return on investment. Insights from large-scale datasets, such as customer satisfaction scores, conversion metrics, and brand tracking, can help marketers refine creative direction, adjust spend allocation, and measure campaign performance with precision.
4. Strengthen customer relationships: Quantitative data enables businesses to track loyalty, satisfaction, and sentiment over time. Metrics such as Net Promoter Score (NPS) or purchase frequency trends provide a measurable way to evaluate customer experiences and identify opportunities to strengthen engagement. Connecting these insights with behavioural data can also help brands predict churn and proactively address customer needs.
5. Drive holistic business decisions: When brands combine connected datasets with advanced analytics, they unlock the ability to make more confident, evidence-based decisions across departments. From forecasting demand to optimising pricing and improving customer retention, quantitative data offers the clarity and confidence needed to align strategy with measurable impact.
Next steps
The most successful modern business is built using data as its driving force. However, data used to support your business must be measurable, reliable, and suitable for driving true action and results. Therefore, using the clear quantitative data questions and the best quantitative data collection methods possible is undeniably important.
Kantar is the trusted source for the most meaningful data. Validated by industry-leading anti-fraud technology, access 170 million people in more than 100 global markets for reliable, quality data. Reach out to learn more about how Kantar can make support the data collection that drives your critical business decisions.