Raw datasets are difficult to analyse. Crosstabs are a simple yet powerful and flexible tool to obtain deeper insights from your data in a form that is easy to digest and act upon. They help you get more insights out of your market research data by working with more than one variable at a time.
Using crosstabs, you can identify relationships between your variables at a glance, receiving better information about what your customers and potential customers want.
What Are Crosstabs?
Crosstabs are tables that present data using two or more variables. Also known as tabulations or cross-tabulations, crosstabs help you aggregate and analyse survey results.
They show you how your variables interact and provide information about how subgroups responded to your survey. Crosstabs are used for providing insights when you have information that can be divided into survey sub samples and want to dig deeper into the data to identify trends and patterns.
For example, if you collected survey data on how many people were planning to buy a new car in the next year, you could use age groups as one variable and gender or income level groups as another. Your crosstabs would show you at a glance the number and/or percentage in each of the groups who have car-buying intentions.
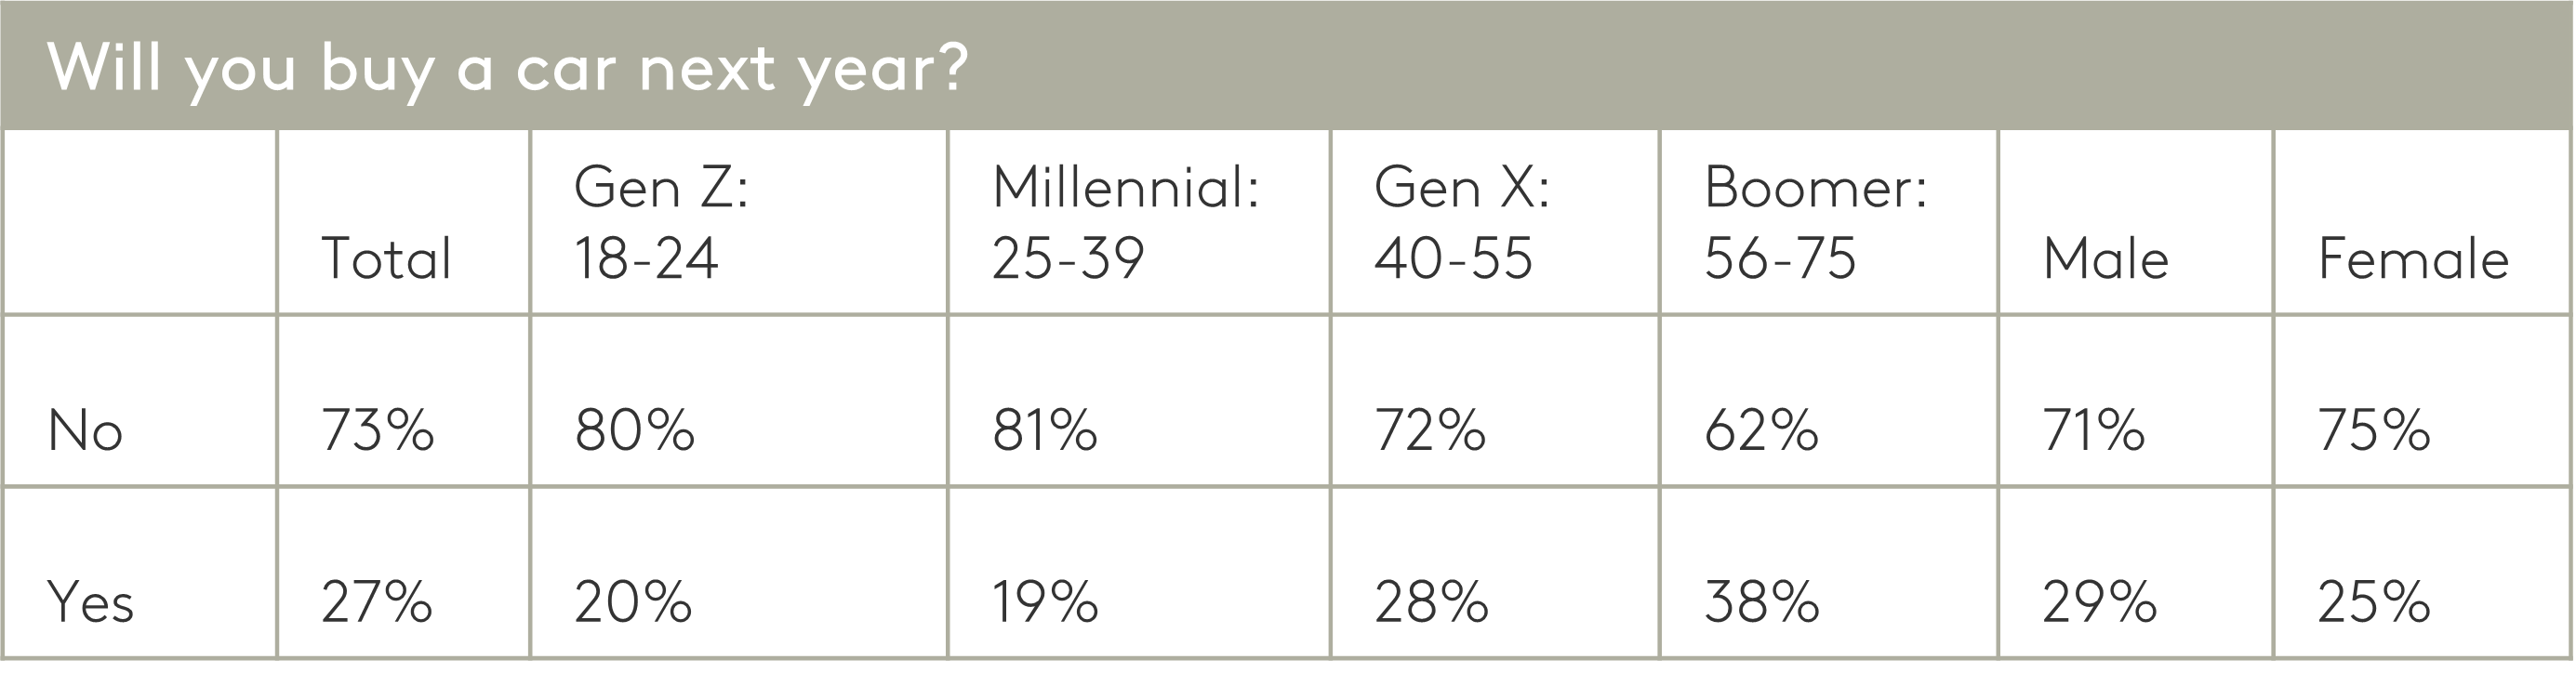
Your crosstabs show the labels for the variables – in this example, age and gender groups – across the top of the table. Each label (also called a banner point) would identify a single column. On the left, you would have the answer choices to your question, in this case “yes” and “no”.
If you have five columns of age and gender groups and two rows of answer options, you would have 12 cells altogether. Each cell would show the data applying to people of a specific demographic who answered a specific way. The data in the cells could be the number of people in each category, the percentage of the total sample that are in that category, or both.
The crosstabs table also shows at a glance the totals for each individual variable as well as the grand total for the whole table. To test whether the associations shown in the crosstabs are statistically significant, you can use a Chi-Square test or a Z-test.
When to Use Crosstabs?
Crosstabs are flexible tools with many uses in market research. You can use them to analyse almost every survey result to get more information from your data. Uses include:
- Making raw data easier to use. You can use crosstabs to highlight insights from the raw data to make it easier for decision makers to process and act on.
- Getting new insights about your customers. You can compare different groups of customers. For example, you could compare customers living in one geographic region versus those in another and use crosstabs to tease out any differences in their levels of satisfaction with your products or services.
- Finding segments of the market to target. You can use crosstabs to find specific segments of your market to target with tailored marketing campaigns.
- Evaluating product needs. Product managers can use crosstabs to analyse survey data to identify product needs or problems that should be addressed.
Benefits of Using Crosstabs
Crosstabs uncover new information from your data that you wouldn’t learn about by looking at just one variable at a time. The benefits include:
Fast Insights
You can quickly create PowerPoint charts or visualisations in Excel directly from the crosstabs themselves.
Error Reduction
Trying to work directly with large datasets leads to confusion and mistakes. Crosstabs help you manage the data and better understand what insights your data contains. They clarify the information, making it easier to access and use.
More Insights
Crosstabs help you get more granular results from your data, showing relationships between variables and information about subgroups that you might otherwise never have discovered.
Actionable Information
The insights you gain from crosstabs give you the quick and accurate information you need to make informed decisions about what actions to take to appeal to the needs of different subgroups.
Clear Information
Crosstabs present information in a form that is easy to see and understand. The insights are quickly accessible to decision makers who are not trained in data analysis.
Greater Depth
Using crosstabs, you can dig deeper into your dataset. For example, if you were examining customer satisfaction by market, you could add in, or nest, another variable, such as age. Then, instead of just finding out the opinions of your customers in one country compared to another country, you could compare Gen-Z customers in the first country to customers in the same age group in other countries.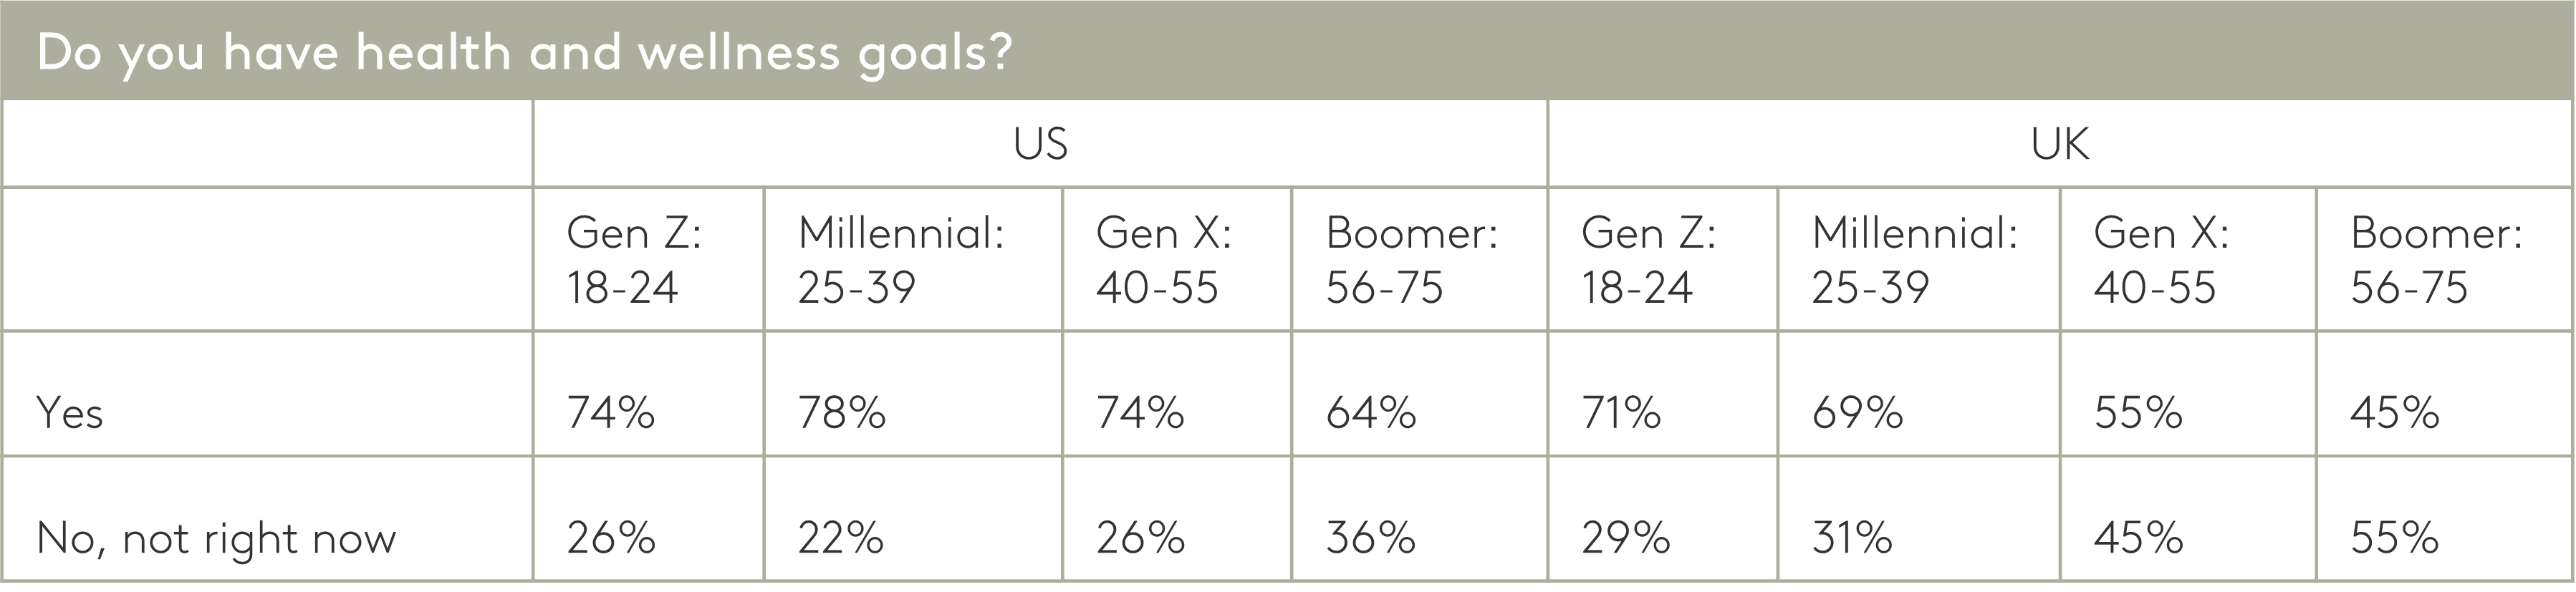
Crosstabs are just one of the many analytical tools that we use at Kantar to provide actionable data that meets your company’s needs. Our focus is on quality and speed, amplified by technology. Contact us to talk to one of our online research experts today.
Work with Kantar for data collection
At Kantar, we're committed to delivering the highest quality data to our clients in a way that suites their resource and budget needs. Talk to our experts today.