

In addition, we looked at FMCG and channel trends for 22 food and beverage categories (note 3) purchased for out-of-home consumption in Tier-1 and Tier-2 cities.
No slowdown for FMCG
China’s market for fast-moving consumer goods (FMCG) for at-home consumption remained robust in 2018, despite general concerns about a slowdown. Total spending on FMCG rose 5.2%, a slight increase over last year’s 4.7% gain. Overall, the two-speed growth scenario we identified in 2016 has continued to evolve, with home care and personal care categories growing at a fast clip while food and beverages maintain a slower pace.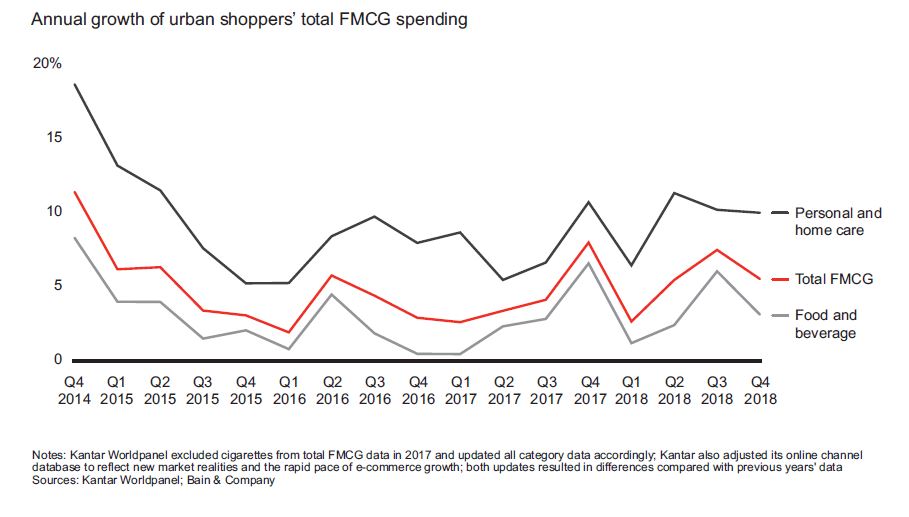
Personal care categories showed the healthiest gains, growing by 10.3% compared with 10.1% in 2017. Premiumization was a big factor in that stellar performance: Average selling prices (ASP) rose by 9.8% as consumers demonstrated a willingness to trade up. Home care categories delivered strong growth of 7.2%, a rebound from their 3%–4% annual growth rate between 2014 and 2017. In home care, it was volume growth, not price increases, that led to the gains.
In the food sector, categories with perceived health benefits, such as nutrient supplements, led the growth, while impulse categories such as chewing gum declined. Overall, food categories registered 4.7% growth, slightly outpacing their 3.4% growth in 2017. Beverage categories’ value grew by only 1.5%, a drop from the 2.8% growth rate in 2017. Within beverages, packaged water reflected a different dynamic. Packaged water’s market size increased due to volume gains—mostly in bulk purchases and large package sizes—not rising prices. Nongfu Spring, the leading packaged water brand, saw volume increase by 20% but average selling price growth drop by 2%. For its part, C’estbon, the No. 2 water brand, watched volume increase by 17% while prices decreased by 3%.
Some beverage companies have found a way to make solid gains, serving as a lesson for FMCG companies across many categories. Carbonated soft drinks (CSD) has grown by 6.6% per year since 2016, due to a combination of big brands’ innovations in packaging and product formula and small brands’ thoughtful moves to benefit from the popularity of “made for China” products. Coca-Cola contributed more than 50% of the category’s growth with the success of such advances as Sprite Fiber Plus, while local brands like Beibingyang introduced distinct Chinese flavors such as sour plum. These domestic companies are winning by making local flavours hip, tapping into a burgeoning “buy China” sentiment.
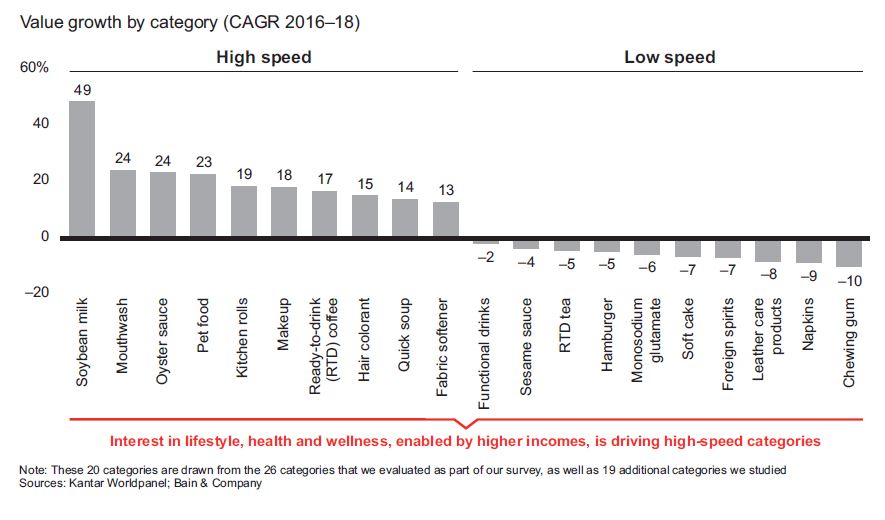
By contrast, consumers are showing less enthusiasm for ready-to-drink (RTD) tea, which saw a 5.1% drop in value since 2017. Part of the reason for the decline: RTD tea consumption has been cannibalized by the popularity of tea shop chains like HeyTea and coffee shop retailers like Luckin Coffee. Coffee is swiftly gaining widespread appeal in China; RTD coffee enjoyed average annual value growth of 17% from 2016 to 2018.
In fact, RTD coffee landed among the top 10 high-speed categories, along with soybean milk, mouthwash, oyster sauce, pet food, kitchen rolls, makeup, hair colorant, quick soup and fabric softener. All of these categories have been propelled by consumers’ interest in improving their lifestyle, health and wellness, a passion enabled by higher incomes. The top 10 low-speed categories include chewing gum, monosodium glutamate, soft cake, hamburger and other categories that are not marketed with the promise of healthier living.
Paths to premiumization
Our research found that most FMCG categories have reached a penetration plateau and are now experiencing declining penetration. As we’ve learned by tracking FMCG activity over the years, when penetration eases, brands typically turn to premiumization (see Figure 5). While many categories may be increasing their average selling prices, few are truly premiumizing with average selling price growth that’s consistently above the rate of inflation, as determined by the consumer price index (roughly 1.8% as of this writing).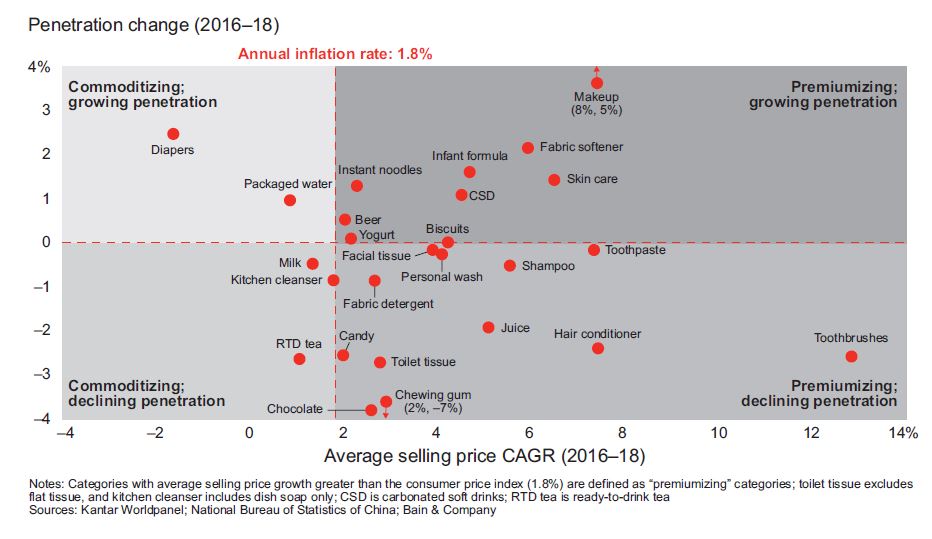
Among categories with “true” premiumization, one group is composed of those that are premiumizing in response to declining penetration. This is the case with many personal care categories such as shampoo and hair conditioner, both of which have experienced drops in penetration and purchase frequency over the past two years.
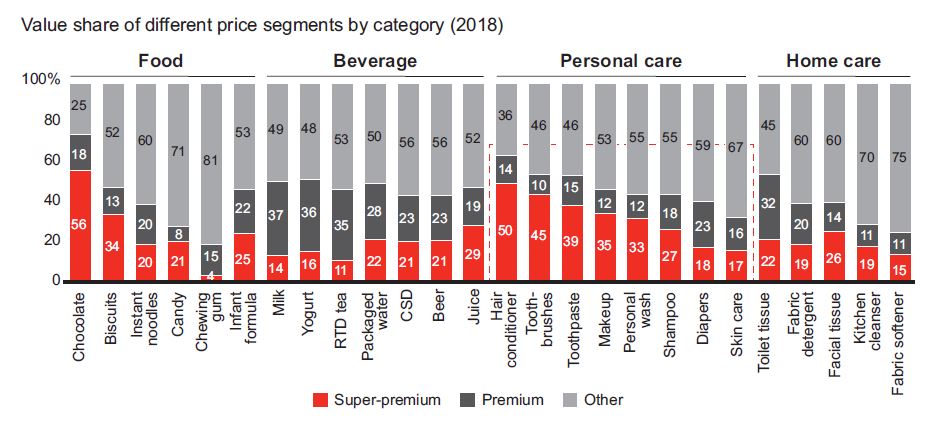
Another group of categories isn’t struggling against stagnant volume. Companies in this group, which includes makeup, skin care, fabric softener, infant formula and carbonated soft drinks, are fortunate enough to increase both prices and penetration. However, not all of the volume gains are coming from the high end. For example, while the growth in fabric softener, infant formula and CSD is largely generated by the premium and super-premium segments, in makeup and skin care, both the high and low ends of the pricing spectrum are expanding. This signals an opportunity for brands in these beauty categories to grow both premium/super-premium and mass/low-end products alike.
Shopping by channels
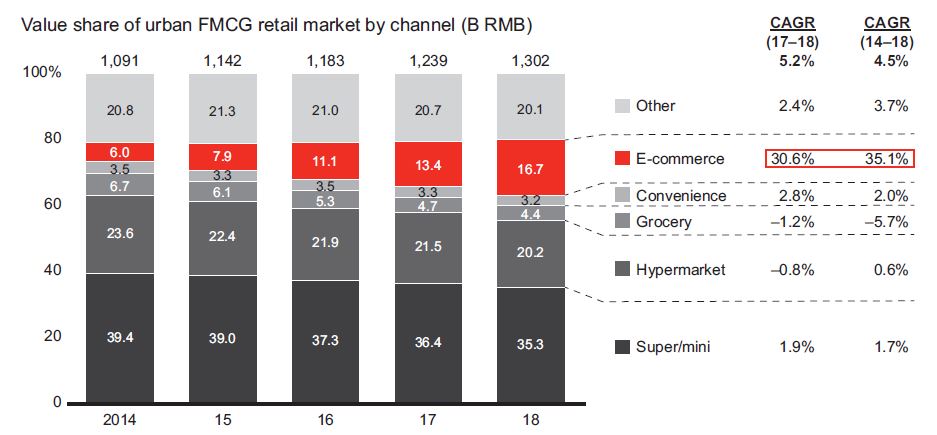
This year, Kantar Worldpanel adjusted its database to reflect the changing market reality and fast evolution of online channels. In this refreshed view, e-commerce represents an even bigger share of the urban FMCG market—16.7% in 2018 compared with 10% using the previous methodology. The data showed that e-commerce channel growth actually slowed slightly for the first time. It grew at a 35.1% annual rate from 2014 to 2018, but by 30.6% between 2017 and 2018. That’s still robust by any standard and stands in stark contrast to the 0.8% decline for hypermarkets and 1.2% drop for grocery stores in 2017–18.
In a trend that has been building for the past few years, Tier-1 cities are reaching a plateau in penetration and purchase frequency. Indeed, Tier-1 cities have the highest online channel spending and online penetration, but that penetration has levelled off at around 80%. Average annual online purchase frequency in Tier-1 cities almost matches that of hypermarkets—20 orders for online vs. a national average of 26 trips for hypermarkets. However, the story is different in lower-tier cities, where we expect growth to continue for at least three or four more years. These cities are catching up fast and will serve as the engine of online expansion.
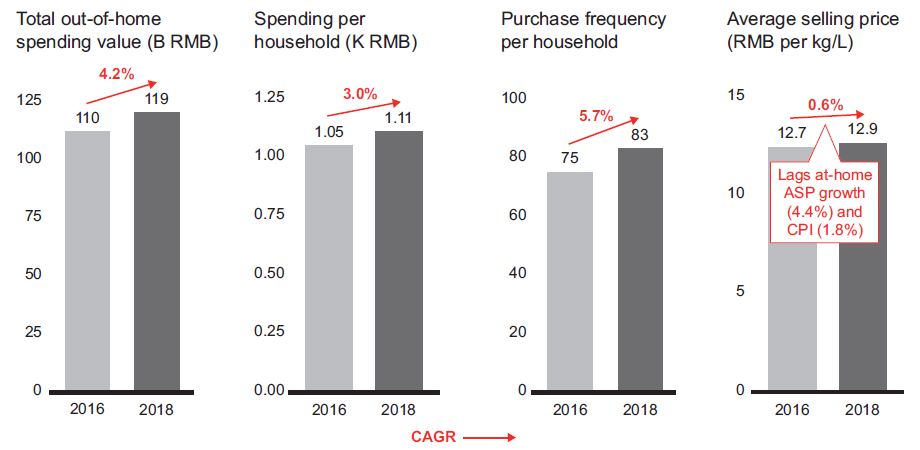
Out-of-home sales rise, but pressure on prices. For the third consecutive year, we analysed Kantar Worldpanel data on FMCG purchases for out-of-home consumption, including 22 categories such as packaged water, Asian traditional drinks, chewing gum, biscuits, beer and nonpackaged ice cream. Kantar Worldpanel tracked sales at convenience stores, hypermarkets, supermarkets, groceries and a range of other outlets—from newsstands and restaurants to tea shops, bars, cinemas, gas stations and vending machines, all in Tier-1 and Tier-2 cities. While total out-of-home spending, per-household spending and purchase frequency all continue to grow, average selling price growth lags both the consumer price index and at-home price growth. The result is slower overall out-of-home spending growth.
What is behind the stagnant average selling price growth for out-of-home sales? The main cause is a more competitive environment for food and beverage categories. There is now heavy competition from New Retail players, for example, and from popular online-to-offline (O2O) food delivery platforms like Meituan and Ele.me, which have heavily promoted their services by offering coupons and discounts. In addition, leading coffee and tea chains have upped their game in delivery of food and beverage products.
However, our research determined that convenience and grocery stores still have great potential to grow out-of-home sales in 10 food and beverage categories: beer, packaged water, RTD tea, juice, CSD, biscuits, chewing gum, chocolate, candy and yogurt. Out-of-home sales represent 88% of those categories’ total sales in convenience stores and nearly 80% in grocery stores.
New hope for offline stores. There is good news for offline stores. While offline channels continued to lose share to online in 2018, the pace of the loss is decelerating. Let’s look at each channel one by one.
Hypermarkets. As we have seen in previous years, China’s shoppers are making fewer trips to hypermarkets thanks to the growing popularity of online channels and O2O delivery. Hypermarkets’ share of the urban FMCG retail market dropped from 23.6% in 2014 to 20.2% in 2018, with lower frequency, flat average volume per household and slightly declining penetration.
Super- and minimarkets. While super- and minimarkets may have lost share in 2018, they still achieved growth of 1.9%. They maintain their position in part because of their proximity to local neighbourhoods.
Traditional trade (groceries). Here, too, we see signs of a turnaround. At-home consumption represents about 20% of spending in grocery stores for Tier-1 and Tier-2 cities, and while that portion of sales is dropping, the rate of decline has slowed from –5.7% for the period 2014–18 to –1.2% in 2018.
Convenience stores. As we noted in last year’s China Shopper Reports, convenience stores remain the healthiest of offline formats. They maintain steady growth as people shop more frequently and spend more, especially for out-of-home consumption in Tier-1 and Tier-2 cities.
Enter New Retail. For the past eight years, we have tracked Chinese shoppers’ behaviour as they shift between offline and online channels. But the truth is the lines are quickly blurring. Online no longer means pure e-commerce, as it has since the days when it was commonly referred to as “Internet shopping.” O2O platforms have emerged. Traditional online platforms like Alibaba are buying offline channels. Traditional brick-and-mortar retailers like Walmart and RT-Mart are embracing online channels. We have been reporting on this trend in its many forms, including:
• Offline retailers using e-commerce and O2O platforms to provide delivery service within three kilometres of offline outlets. Think Walmart’s investment in Dada-JD Daojia and RT-Mart’s partnership with Alibaba.
• The upgrading of offline retailing, including Alibaba’s Lingshoutong (LST) inventory management platform and JD.com’s Xintonglu (XTL).
• The New Retail format, which enables seamless integration of online and offline shopping experiences by building a retail ecosystem. Major players such as Hema, Carrefour Le Marche and
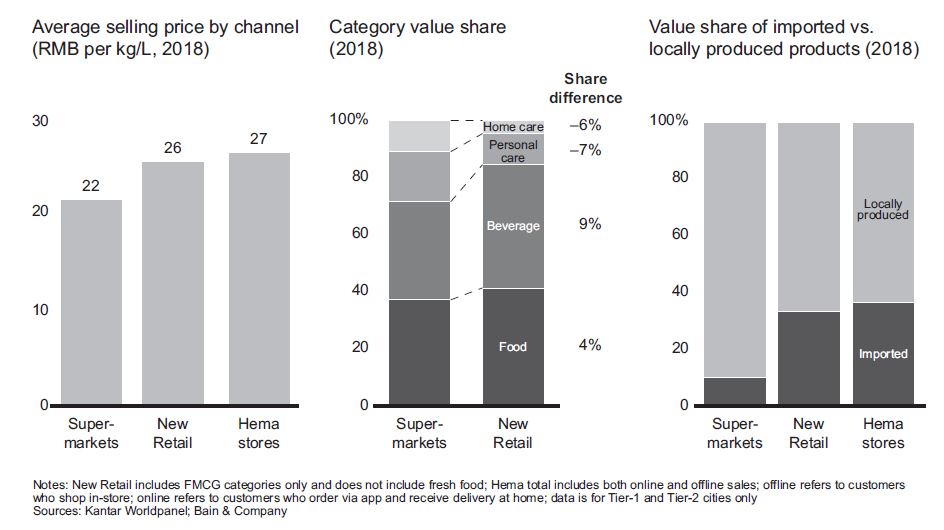
Yonghui’s Super Species are supermarkets where consumers can order online, shop in the store and enjoy multiple dining menus, on-site or delivered. New Retail stores devote much of their space to in-store dining and also serve as delivery hubs. Now limited to Tier-1 and Tier-2 cities, New Retail is still in the early stages of development, with 5% penetration and lower purchase frequency than traditional physical channels. However, these New Retail outlets, which cater to younger and higher-income shoppers, are benefiting from higher average selling prices and have a bigger mix of food and beverages, as well as imported products.
As pure online channels see the limits of growth, we believe the tide is turning for offline channels. Physical stores will take on new roles, including the many dimensions of New Retail. The offline formats that come out on top will be those that do the best job of serving the new and constantly changing needs of Chinese consumers—offering quick delivery or investing to differentiate with fresh food and exciting ready-to-eat menus, for example.
Winning brands: Small vs. large, local vs. foreign
In China Shopper Report 2018, Vol. 2, Local Insurgents Shake Up China’s “Two-Speed” Market, we showed how China’s insurgent brands are taking a disproportionate share of FMCG growth. These are brands like Bliss Cake, ChaoNeng and Yunnan Baiyao—names that were not easily recognized until a few years ago.The trend has continued this year with a vengeance. We first looked at the growth of the top 20 brands compared with smaller brands, and the picture is very telling: Across many categories, small brands account for more category value growth than their top 20 counterparts.
Over the last three years, those big, established brands have lost share in most categories—16% in diapers, 7% in RTD tea and 5% in juice, for example. In fact, the top five brands have managed to gain meaningful share in only four categories: toothbrushes, milk, packaged water and makeup.
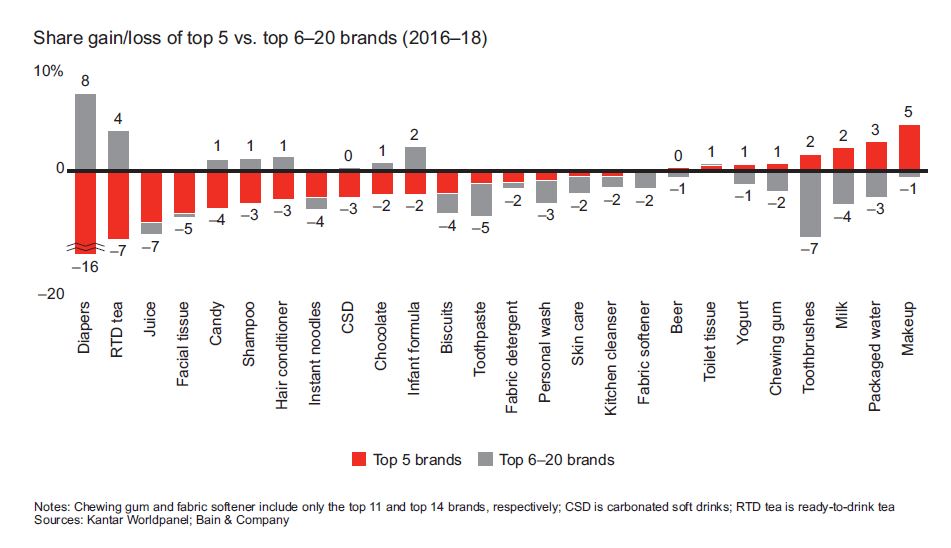
Smaller brands are the growth leaders—they grew faster than the top five brands in all categories except makeup and packaged water. Small brands have many things in their favour: They are adept at serving an unmet consumer need, they are often better skilled than their larger counterparts at digital marketing and social media, and many have asset-light business models that give them an edge over well-established consumer goods companies.
The fragmentation observed in most categories, with smaller insurgent brands gaining share against the top five brands, can be partially explained by increasing “repertoire” behaviour among Chinese consumers. We looked at four categories in detail: makeup, biscuits, milk and infant formula, which are representative of the repertoire-loyalist spectrum8 and the low-high e-commerce penetration dimension. The first observation is that all four categories are more repertoire today than they were two years ago. Second, online consumers demonstrate much more pronounced repertoire behaviour than offline consumers. As consumers move more and more online, their repertoire behaviour will increase.
Against this backdrop, whether to focus on growing big brands or on building a portfolio of different brands to serve different segments is a question that nags at every FMCG executive. It’s a decision that sometimes calls for a major strategic transformation; billion-dollar brands are vastly different animals than US$25 million brands, requiring significantly different management approaches and operating models.
The foreign vs. local battle continues.
As we have seen every year, local players continued to gain share over foreign competitors on an aggregate basis. Chinese brands have grown by 15% since 2016, contributing 76% of market growth in 2018. By comparison, foreign brands grew more slowly—by 9% since 2016—and contributed 24% of last year’s market growth. The encouraging news for foreign brands: Despite being outpaced by domestic companies, that 24% share of market growth is actually double the rate of 2017.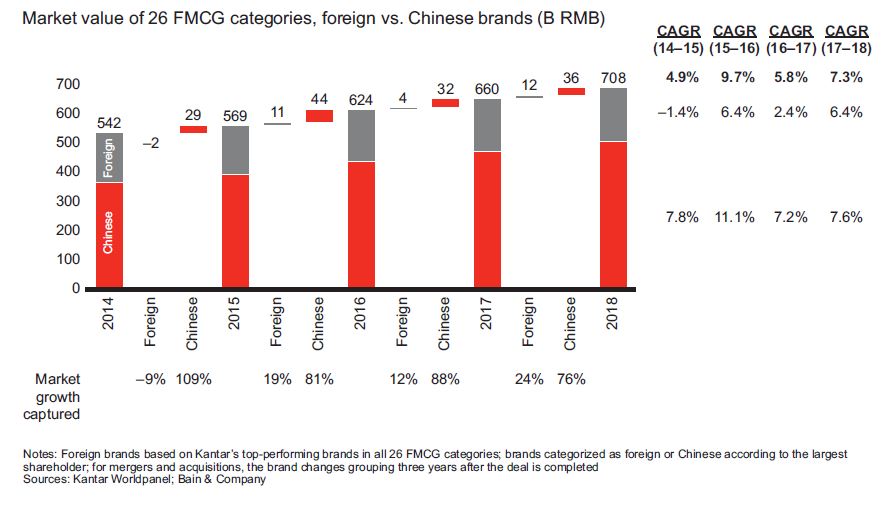
Foreign brands are learning what it takes to win in China. It requires keeping pace with the market’s rapid changes and a “4D” approach: design for China, decide in China, deliver at China speed and digitalize the China business.
Truth is, local and foreign brands alike can discover ways to win. In the toothbrush category, for example, Philips and Oral-B grew more than three times their category average by investing to innovate electric toothbrushes and with a focus on online channels, which account for 60% of those brands’ sales. Among local companies, toothpaste brands like Yunnan Baiyao and Pien Tze Huang have grown twice as fast as the category average by featuring new products that contain traditional Chinese medicine ingredients.
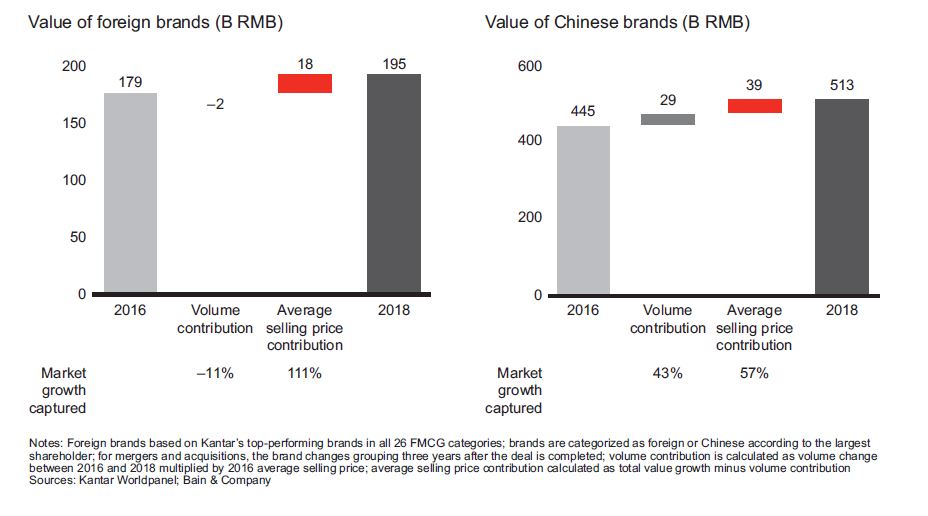
All of these companies—foreign and local—have received a message that could serve as a mantra for success with China’s shoppers: Premiumization can be a key to growth. However, Chinese brands demonstrate the importance of having a growth model that is more evenly balanced between volume and premiumization.
Implications for brands and retailers
How brands can win.The three key implications for brands that we mentioned last year still hold true:
• Take advantage of channel dynamics, grow with the winning channels and anticipate retailers’ consolidation;
• Develop high-value and personalized products to make the most of the premiumization trend; and
• Become a data-driven, consumer-centric organization by collaborating with platforms but also by developing your own set of consumer data.
This year we add a fourth important implication based on the success of insurgent brands:
• Develop a portfolio of brands to grow overall share in a category, taking advantage of the fragmentation of consumer needs and shoppers’ thirst for innovations.
How retailers can win.The acceleration of New Retail presents opportunities for retailers to transition from today’s mass-oriented, offline approach to tomorrow’s seamless, multichannel world of shopping. Physical stores have a future, but offline retailers need to refine their moves to play in this new environment. Specifically, they’ll need to:
• Redesign store portfolios in the New Retail format;
• Make the store experience more attractive by leveraging new technologies like augmented reality; and
• Digitalize operations to deliver a seamless experience to consumers, whether they buy online or offline, and start to monetize consumer data for better cooperation with brands.
EDITOR'S NOTES
Note 1: These 26 categories are a) packaged food: biscuits, chocolate, instant noodles, candy, chewing gum and infant formula; b) beverages: milk, yogurt, juice, beer, ready-to-drink (RTD) tea, carbonated soft drinks (CSD) and packaged water; c) personal care: skin care, shampoo, personal wash, toothpaste, makeup, hair conditioner, diapers and toothbrushes; and d) home care: toilet tissue, fabric detergent, facial tissue, kitchen cleanser and fabric softener;
Note 2: These 19 categories are soybean milk, mouthwash, oyster sauce, pet food, kitchen rolls, RTD coffee, hair colorant, quick soup, functional drinks, sesame sauce, hamburger, monosodium glutamate, soft cake, foreign spirits, leather care products, napkins, Chinese spirits, cooking oil and nutrient supplements;
Note 3: These 22 categories are packaged water, Asian traditional drinks and RTD tea, juice, CSD, RTD coffee, milk tea, functional drinks, non-RTD (on-premise) drinks, biscuits, chocolate, chewing gum, candy, bubble gum, mints, throat drops, salty snacks, beer, yogurt, milk, soybean milk, packaged ice cream and nonpackaged (on-premise) ice cream.
* To reach the author, or to know more information, data and analysis of China's FMCG market, please contact us ;