Have you ever run a survey and wondered if it’s producing reliable, quality data?
There are several ways you can check the quality of data your survey is delivering. Here are our top tips on how to analyse your data to test its quality. This can be done after a soft launch of your survey or between waves of your tracking research.
Why quality check surveys?
First off, quality-checking surveys is of paramount importance in ensuring the reliability and validity of collected data. By conducting thorough quality checks, researchers can identify and rectify any errors, inconsistencies, or biases that may arise during the survey administration process. This critical step helps maintain the integrity of the data and ultimately enhances the credibility of the research findings.
One key reason for quality-checking surveys is to ensure the accuracy of responses. By reviewing the survey instruments, researchers can verify that the questions are clear, unambiguous, and properly aligned with the research objectives. This minimizes the likelihood of respondents misinterpreting questions or providing inaccurate information, leading to more reliable data.
Moreover, quality checking helps detect and address potential sources of bias. Researchers can examine the survey design, response options, and skip patterns to identify any elements that may inadvertently influence respondents' answers. By addressing these biases, researchers can obtain more objective and unbiased data, leading to more robust conclusions and insights.
Additionally, quality-checking surveys allows researchers to assess the overall survey experience. They can evaluate factors such as the length of the questionnaire, the organization of questions, and the user-friendliness of the survey platform. This helps enhance respondent satisfaction and engagement, ultimately improving the response rate and the quality of data collected.
In summary, quality-checking surveys is a vital step in the research process. It ensures data accuracy, minimizes bias, and enhances respondent experience. By investing time and effort into quality assurance, researchers can trust the integrity of their data and draw meaningful conclusions from their research.
6 ways to review the quality of your survey data
Click count check
The first, and simplest, thing to do is a click count check. A click count check involves reviewing the number of clicks at each option choice in a question. There is no point in offering up a choice in a survey if nobody is selecting it. For a respondent, it’s a waste of reading time.
We recommend removing options if less than 3% of respondents select them. Bear in mind that the average respondent miss-click rate on multi-choice questions is around 2%. Therefore, for any option receiving under 4% click rates, you should expect at least half of these clicks to be random. This is why the quality of data from options below this 3% threshold is not trustworthy.
Click count decay rate check
If you have any repetitive loops of a question, it’s worth checking the click decay rate. A click decay rate is a drop in clicks from one loop to the next. It is important to note, however, this is only possible if the loops are not randomised. (A side tip for when you are writing your survey is to turn off loop randomisation so you can properly check this.)
You would expect a 30% decay rate in clicks from the first to the second loop and 20% from the second to the third loop. If you experience anything higher than this, you may want to consider improving the question.
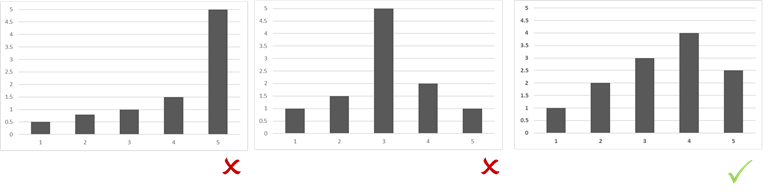
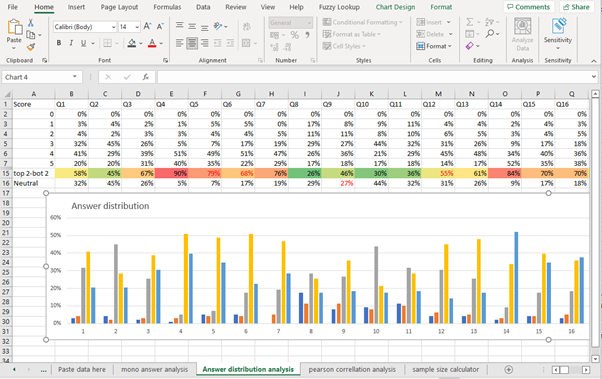
Scale question-answer distribution check
If you have any scale questions in your survey, we recommended reviewing how the answers are distributed across the scale. For example, if everyone is strongly agreeing with a statement, it is hardly worth asking and you might want to consider dropping the question. If many people are selecting ‘neither agree nor disagree’, it is a sign that respondents are not on board with how you have asked this question, so you may need to re-write.
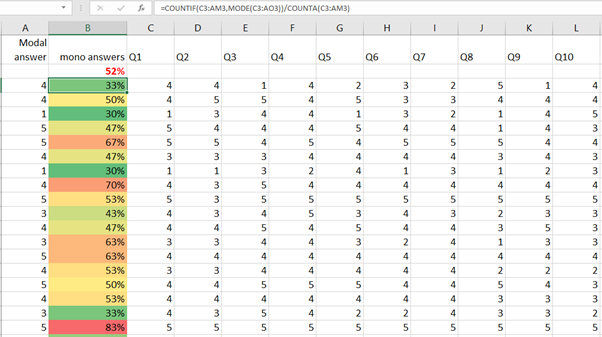
Mono answers check
If you have a run of Likert scales, we highly recommend examining how many mono answers respondents are giving. The level of mono answering is a measure of how often a respondent selects the same option on the scale over and over.
It is easy to calculate this from the raw data in excel. First, assess what each respondent’s modal answer is (the option they select most often). Then run a count of how many times it is selected (see the formula in the image below). If the average number of mono answers is above 50% of the overall total, it is a sign that respondents are not concentrating when answering your survey questions and you might want to consider improvements to that part of the survey.
You can also use this method to clean out respondents who are giving a very high number of mono answers. A note of caution when doing this: if the data is from a customer satisfaction survey and a respondent has top-box or bottom-box scored everything – that might simply be a very happy or very unhappy customer!
Standard deviation check
Another data check you can do for a Likert scale is to assess the standard deviation in the answer. This calculates the level of variance there is. As a rule of thumb, if the average standard deviation on a 5-point Likert scale is below 1, you might want to rethink how you are asking the question. This is a sign respondents are giving low-quality answers.
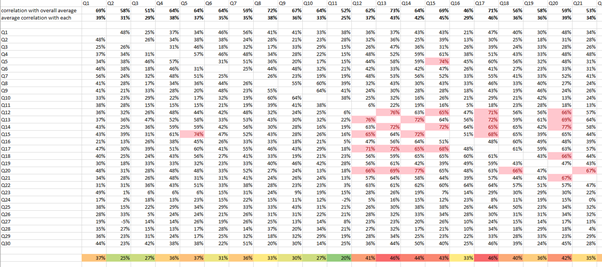
Pearson Correlation analysis
Continuing with Likert scale questions, we also recommend conducting a Pearson Correlation analysis. This compares how similar the answers are between different questions. If respondents are giving answers that are very similar to any two questions correlating above c0.65, you might want to consider refining or removing one of the questions.
Answer consistency check
Evaluating the overall consistency of answers from each respondent is another great check.
Take for example an awareness question of different soft drink brands where the list includes Coke and Pepsi (brands you assume most people are aware of) alongside new brands (some that you expect very few people to be aware of). If a respondent has not selected Coke but has selected the new brand, it is a sign that the respondent is not concentrating on their answers.
By identifying these high and low incidence rate question options, you can look at how consistently each respondent is selecting them. Score respondents based on how many of the high and how few of the low incidence options they have clicked on. You may wish to omit high-scoring respondents' answers when analysing the data from these questions. This technique can be done on the question level or the survey as a whole.
Get the data quality check template
If you would like to run these quality checks on your own survey results, we have a spreadsheet already built for analysing data from any survey question. Simply cut and paste your survey data into our excel template and it will automatically map the answer distribution, calculate the number of mono answers and standard deviation in answers, and perform a Pearson Correlation analysis. Fill out the form below to access this free tool.